Lachnoclostridium sp. An181
Taxonomy: cellular organisms; Bacteria; Terrabacteria group; Firmicutes; Clostridia; Eubacteriales; Lachnospiraceae; Lachnoclostridium; unclassified Lachnoclostridium
Average proteome isoelectric point is 6.25
Get precalculated fractions of proteins
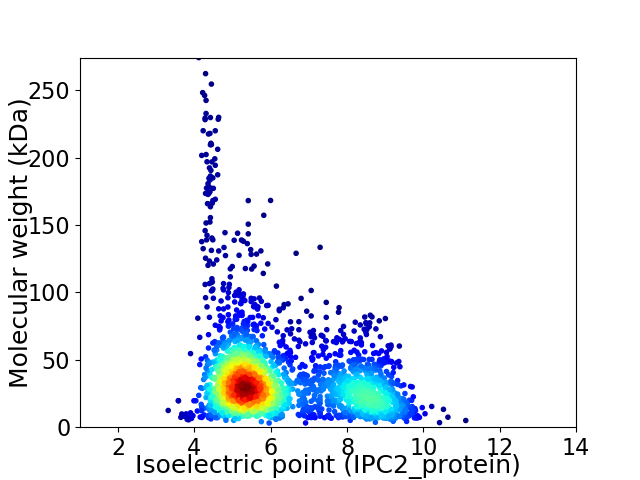
Virtual 2D-PAGE plot for 2355 proteins (isoelectric point calculated using IPC2_protein)
Get csv file with sequences according to given criteria:
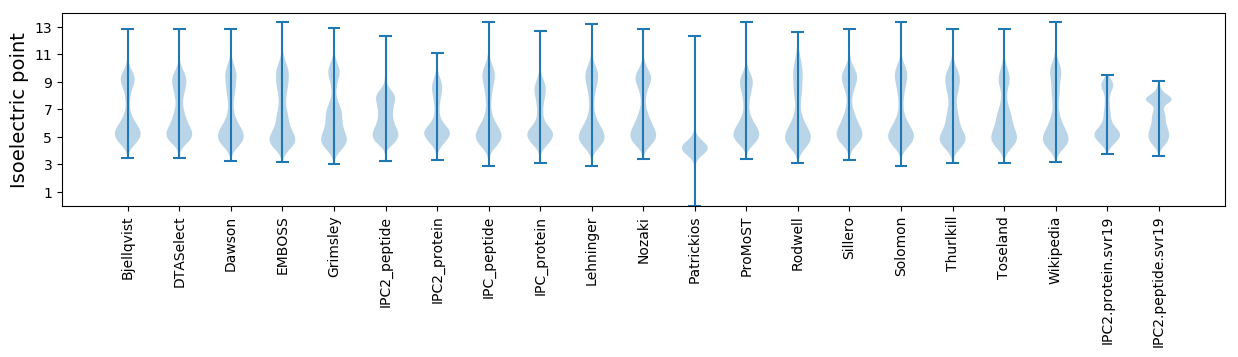
* You can choose from 21 different methods for calculating isoelectric point
Summary statistics related to proteome-wise predictions
Protein with the lowest isoelectric point:
>tr|A0A1Y4L023|A0A1Y4L023_9FIRM CRISPR-associated endoribonuclease Cas6 OS=Lachnoclostridium sp. An181 OX=1965575 GN=B5F18_05025 PE=4 SV=1
MM1 pKa = 6.46TQEE4 pKa = 3.87DD5 pKa = 4.94AIAFGDD11 pKa = 3.79GDD13 pKa = 4.04NDD15 pKa = 3.41IEE17 pKa = 4.15MLQAVGLGIAMEE29 pKa = 4.23NASDD33 pKa = 4.32KK34 pKa = 11.12LKK36 pKa = 9.35QTADD40 pKa = 4.04EE41 pKa = 4.47ICGHH45 pKa = 5.25VAGDD49 pKa = 4.0GIYY52 pKa = 10.16YY53 pKa = 9.58YY54 pKa = 10.49CANRR58 pKa = 11.84GLII61 pKa = 3.82
MM1 pKa = 6.46TQEE4 pKa = 3.87DD5 pKa = 4.94AIAFGDD11 pKa = 3.79GDD13 pKa = 4.04NDD15 pKa = 3.41IEE17 pKa = 4.15MLQAVGLGIAMEE29 pKa = 4.23NASDD33 pKa = 4.32KK34 pKa = 11.12LKK36 pKa = 9.35QTADD40 pKa = 4.04EE41 pKa = 4.47ICGHH45 pKa = 5.25VAGDD49 pKa = 4.0GIYY52 pKa = 10.16YY53 pKa = 9.58YY54 pKa = 10.49CANRR58 pKa = 11.84GLII61 pKa = 3.82
Molecular weight: 6.5 kDa
Isoelectric point according different methods:
Protein with the highest isoelectric point:
>tr|A0A1Y4KW77|A0A1Y4KW77_9FIRM ATP synthase epsilon chain OS=Lachnoclostridium sp. An181 OX=1965575 GN=atpC PE=3 SV=1
MM1 pKa = 7.67KK2 pKa = 8.72MTFQPKK8 pKa = 9.06KK9 pKa = 8.03RR10 pKa = 11.84SRR12 pKa = 11.84SKK14 pKa = 9.44VHH16 pKa = 6.17GFRR19 pKa = 11.84ARR21 pKa = 11.84MSTAGGRR28 pKa = 11.84KK29 pKa = 8.71VLAARR34 pKa = 11.84RR35 pKa = 11.84AKK37 pKa = 10.18GRR39 pKa = 11.84KK40 pKa = 8.18QLSAA44 pKa = 3.9
MM1 pKa = 7.67KK2 pKa = 8.72MTFQPKK8 pKa = 9.06KK9 pKa = 8.03RR10 pKa = 11.84SRR12 pKa = 11.84SKK14 pKa = 9.44VHH16 pKa = 6.17GFRR19 pKa = 11.84ARR21 pKa = 11.84MSTAGGRR28 pKa = 11.84KK29 pKa = 8.71VLAARR34 pKa = 11.84RR35 pKa = 11.84AKK37 pKa = 10.18GRR39 pKa = 11.84KK40 pKa = 8.18QLSAA44 pKa = 3.9
Molecular weight: 4.97 kDa
Isoelectric point according different methods:
Peptides (in silico digests for buttom-up proteomics)
Below you can find in silico digests of the whole proteome with Trypsin, Chymotrypsin, Trypsin+LysC, LysN, ArgC proteases suitable for different mass spec machines.| Try ESI |
 |
|---|
| ChTry ESI |
|
|---|
| ArgC ESI |
|
|---|
| LysN ESI |
|
|---|
| TryLysC ESI |
|
|---|
| Try MALDI |
|
|---|
| ChTry MALDI |
|
|---|
| ArgC MALDI |
|
|---|
| LysN MALDI |
|
|---|
| TryLysC MALDI |
|
|---|
| Try LTQ |
|
|---|
| ChTry LTQ |
|
|---|
| ArgC LTQ |
|
|---|
| LysN LTQ |
|
|---|
| TryLysC LTQ |
|
|---|
| Try MSlow |
|
|---|
| ChTry MSlow |
|
|---|
| ArgC MSlow |
|
|---|
| LysN MSlow |
|
|---|
| TryLysC MSlow |
|
|---|
| Try MShigh |
|
|---|
| ChTry MShigh |
|
|---|
| ArgC MShigh |
|
|---|
| LysN MShigh |
|
|---|
| TryLysC MShigh |
|
|---|
General Statistics
Number of major isoforms |
Number of additional isoforms |
Number of all proteins |
Number of amino acids |
Min. Seq. Length |
Max. Seq. Length |
Avg. Seq. Length |
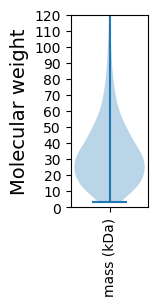
Avg. Mol. Weight |
|---|---|---|---|---|---|---|---|
0 |
821853 |
27 |
2505 |
349.0 |
39.2 |
Amino acid frequency
Ala |
Cys |
Asp |
Glu |
Phe |
Gly |
His |
Ile |
Lys |
Leu |
|---|---|---|---|---|---|---|---|---|---|
7.404 ± 0.06 | 1.325 ± 0.025 |
5.711 ± 0.054 | 8.319 ± 0.059 |
4.068 ± 0.041 | 7.189 ± 0.043 |
1.661 ± 0.019 | 6.999 ± 0.05 |
7.61 ± 0.044 | 8.681 ± 0.06 |
Met |
Asn |
Gln |
Pro |
Arg |
Ser |
Thr |
Val |
Trp |
Tyr |
|---|---|---|---|---|---|---|---|---|---|
3.064 ± 0.027 | 4.298 ± 0.04 |
3.111 ± 0.024 | 3.277 ± 0.028 |
4.162 ± 0.045 | 5.544 ± 0.038 |
5.438 ± 0.049 | 7.079 ± 0.046 |
0.984 ± 0.017 | 4.077 ± 0.031 |
Most of the basic statistics you can see at this page can be downloaded from this CSV file
See this proteome in:

Proteome-pI is available under Creative Commons Attribution-NoDerivs license, for more details see here
| Reference: Kozlowski LP. Proteome-pI 2.0: Proteome Isoelectric Point Database Update. Nucleic Acids Res. 2021, doi: 10.1093/nar/gkab944 | Contact: Lukasz P. Kozlowski |