Escherichia phage P1 (Bacteriophage P1)
Taxonomy: Viruses; Duplodnaviria; Heunggongvirae; Uroviricota; Caudoviricetes; Caudovirales; Myoviridae; Punavirus
Average proteome isoelectric point is 6.62
Get precalculated fractions of proteins
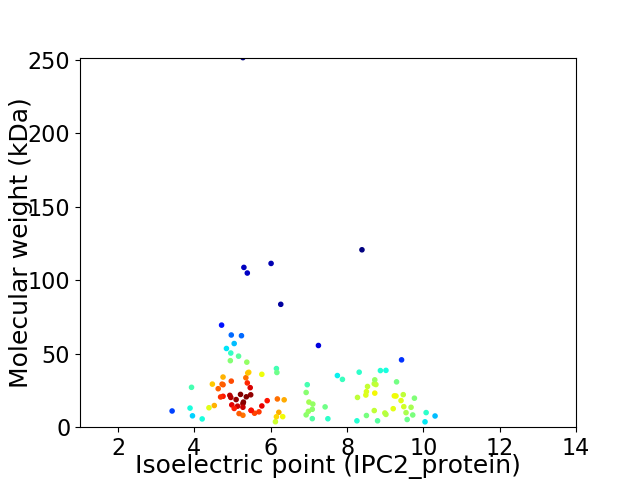
Virtual 2D-PAGE plot for 110 proteins (isoelectric point calculated using IPC2_protein)
Get csv file with sequences according to given criteria:
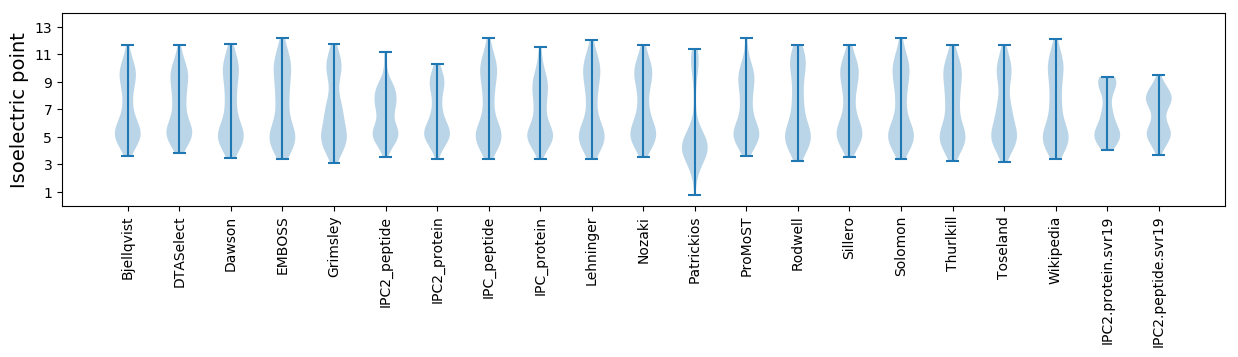
* You can choose from 21 different methods for calculating isoelectric point
Summary statistics related to proteome-wise predictions
Protein with the lowest isoelectric point:
>tr|Q71T60|Q71T60_BPP1 C1.100 OS=Escherichia phage P1 OX=10678 GN=c1.100 PE=4 SV=1
MM1 pKa = 7.54AFIPPTIDD9 pKa = 4.44DD10 pKa = 3.84VRR12 pKa = 11.84HH13 pKa = 6.05CSNALSVDD21 pKa = 3.55PAEE24 pKa = 4.25TDD26 pKa = 3.0AARR29 pKa = 11.84AIAEE33 pKa = 4.36HH34 pKa = 6.3YY35 pKa = 10.88SKK37 pKa = 10.62ISNQEE42 pKa = 3.46YY43 pKa = 10.42RR44 pKa = 11.84ITQDD48 pKa = 4.89DD49 pKa = 4.74LDD51 pKa = 5.05DD52 pKa = 4.06LTDD55 pKa = 4.01TIEE58 pKa = 4.42YY59 pKa = 10.89LMATNQPDD67 pKa = 3.65SQQ69 pKa = 3.69
MM1 pKa = 7.54AFIPPTIDD9 pKa = 4.44DD10 pKa = 3.84VRR12 pKa = 11.84HH13 pKa = 6.05CSNALSVDD21 pKa = 3.55PAEE24 pKa = 4.25TDD26 pKa = 3.0AARR29 pKa = 11.84AIAEE33 pKa = 4.36HH34 pKa = 6.3YY35 pKa = 10.88SKK37 pKa = 10.62ISNQEE42 pKa = 3.46YY43 pKa = 10.42RR44 pKa = 11.84ITQDD48 pKa = 4.89DD49 pKa = 4.74LDD51 pKa = 5.05DD52 pKa = 4.06LTDD55 pKa = 4.01TIEE58 pKa = 4.42YY59 pKa = 10.89LMATNQPDD67 pKa = 3.65SQQ69 pKa = 3.69
Molecular weight: 7.74 kDa
Isoelectric point according different methods:
Protein with the highest isoelectric point:
>sp|Q9XJG4|SSB_BPP1 Single-stranded DNA-binding protein OS=Escherichia phage P1 OX=10678 GN=ssb PE=3 SV=1
MM1 pKa = 7.57ASVSISCPSCSATDD15 pKa = 3.7GVVRR19 pKa = 11.84NGKK22 pKa = 8.27STAGHH27 pKa = 4.88QRR29 pKa = 11.84YY30 pKa = 8.94LCSHH34 pKa = 6.46CRR36 pKa = 11.84KK37 pKa = 7.49TWQLQFTYY45 pKa = 9.73TASQPGTHH53 pKa = 5.79QKK55 pKa = 10.33IIDD58 pKa = 3.52MAMNGVGCRR67 pKa = 11.84ATARR71 pKa = 11.84IMGVGLNTIFRR82 pKa = 11.84HH83 pKa = 5.51LKK85 pKa = 8.99NSGRR89 pKa = 11.84SRR91 pKa = 3.37
MM1 pKa = 7.57ASVSISCPSCSATDD15 pKa = 3.7GVVRR19 pKa = 11.84NGKK22 pKa = 8.27STAGHH27 pKa = 4.88QRR29 pKa = 11.84YY30 pKa = 8.94LCSHH34 pKa = 6.46CRR36 pKa = 11.84KK37 pKa = 7.49TWQLQFTYY45 pKa = 9.73TASQPGTHH53 pKa = 5.79QKK55 pKa = 10.33IIDD58 pKa = 3.52MAMNGVGCRR67 pKa = 11.84ATARR71 pKa = 11.84IMGVGLNTIFRR82 pKa = 11.84HH83 pKa = 5.51LKK85 pKa = 8.99NSGRR89 pKa = 11.84SRR91 pKa = 3.37
Molecular weight: 9.9 kDa
Isoelectric point according different methods:
Peptides (in silico digests for buttom-up proteomics)
Below you can find in silico digests of the whole proteome with Trypsin, Chymotrypsin, Trypsin+LysC, LysN, ArgC proteases suitable for different mass spec machines.| Try ESI |
 |
|---|
| ChTry ESI |
|
|---|
| ArgC ESI |
|
|---|
| LysN ESI |
|
|---|
| TryLysC ESI |
|
|---|
| Try MALDI |
|
|---|
| ChTry MALDI |
|
|---|
| ArgC MALDI |
|
|---|
| LysN MALDI |
|
|---|
| TryLysC MALDI |
|
|---|
| Try LTQ |
|
|---|
| ChTry LTQ |
|
|---|
| ArgC LTQ |
|
|---|
| LysN LTQ |
|
|---|
| TryLysC LTQ |
|
|---|
| Try MSlow |
|
|---|
| ChTry MSlow |
|
|---|
| ArgC MSlow |
|
|---|
| LysN MSlow |
|
|---|
| TryLysC MSlow |
|
|---|
| Try MShigh |
|
|---|
| ChTry MShigh |
|
|---|
| ArgC MShigh |
|
|---|
| LysN MShigh |
|
|---|
| TryLysC MShigh |
|
|---|
General Statistics
Number of major isoforms |
Number of additional isoforms |
Number of all proteins |
Number of amino acids |
Min. Seq. Length |
Max. Seq. Length |
Avg. Seq. Length |
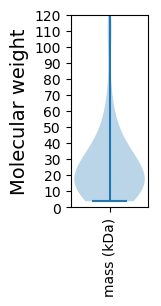
Avg. Mol. Weight |
|---|---|---|---|---|---|---|---|
0 |
28126 |
31 |
2255 |
255.7 |
28.53 |
Amino acid frequency
Ala |
Cys |
Asp |
Glu |
Phe |
Gly |
His |
Ile |
Lys |
Leu |
|---|---|---|---|---|---|---|---|---|---|
9.269 ± 0.332 | 1.102 ± 0.127 |
6.094 ± 0.17 | 6.638 ± 0.222 |
3.673 ± 0.166 | 6.496 ± 0.314 |
1.792 ± 0.143 | 6.034 ± 0.135 |
6.034 ± 0.255 | 8.714 ± 0.187 |
Met |
Asn |
Gln |
Pro |
Arg |
Ser |
Thr |
Val |
Trp |
Tyr |
|---|---|---|---|---|---|---|---|---|---|
2.627 ± 0.117 | 4.707 ± 0.205 |
3.883 ± 0.125 | 4.028 ± 0.145 |
5.977 ± 0.248 | 6.659 ± 0.205 |
5.717 ± 0.281 | 6.218 ± 0.15 |
1.262 ± 0.097 | 3.075 ± 0.158 |
Most of the basic statistics you can see at this page can be downloaded from this CSV file
See this proteome in:

Proteome-pI is available under Creative Commons Attribution-NoDerivs license, for more details see here
| Reference: Kozlowski LP. Proteome-pI 2.0: Proteome Isoelectric Point Database Update. Nucleic Acids Res. 2021, doi: 10.1093/nar/gkab944 | Contact: Lukasz P. Kozlowski |