Bacillus phage SPbeta (Bacillus phage SPBc2) (Bacteriophage SP-beta)
Taxonomy: Viruses; Duplodnaviria; Heunggongvirae; Uroviricota; Caudoviricetes; Caudovirales; Siphoviridae; Spbetavirus
Average proteome isoelectric point is 6.29
Get precalculated fractions of proteins
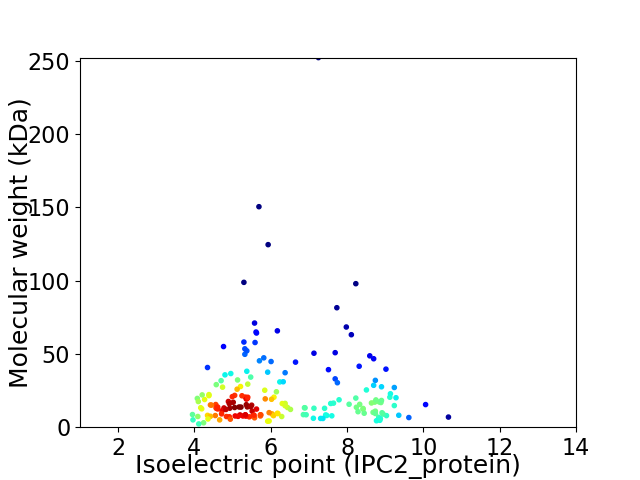
Virtual 2D-PAGE plot for 185 proteins (isoelectric point calculated using IPC2_protein)
Get csv file with sequences according to given criteria:
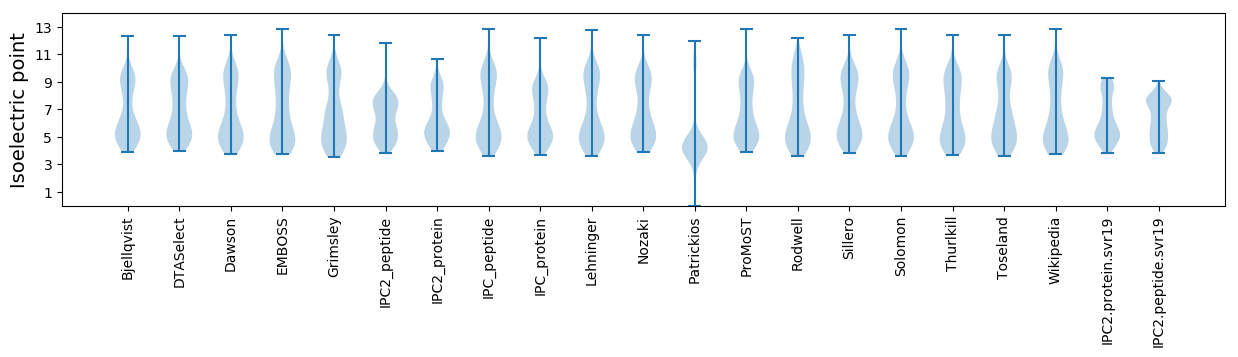
* You can choose from 21 different methods for calculating isoelectric point
Summary statistics related to proteome-wise predictions
Protein with the lowest isoelectric point:
>tr|O64053|O64053_BPSPB YomQ protein OS=Bacillus phage SPbeta OX=66797 GN=yomQ PE=4 SV=1
MM1 pKa = 7.52SNFWVIALNKK11 pKa = 9.7NWATLDD17 pKa = 3.63QVKK20 pKa = 9.61EE21 pKa = 3.73AYY23 pKa = 10.47YY24 pKa = 10.68YY25 pKa = 11.21DD26 pKa = 4.99DD27 pKa = 3.56VTKK30 pKa = 10.94EE31 pKa = 3.94EE32 pKa = 4.32LKK34 pKa = 11.08EE35 pKa = 4.12GVDD38 pKa = 3.73NNLITPEE45 pKa = 3.98QYY47 pKa = 10.35QEE49 pKa = 4.17IVGEE53 pKa = 4.44AYY55 pKa = 9.72TSVTLSTEE63 pKa = 3.68
MM1 pKa = 7.52SNFWVIALNKK11 pKa = 9.7NWATLDD17 pKa = 3.63QVKK20 pKa = 9.61EE21 pKa = 3.73AYY23 pKa = 10.47YY24 pKa = 10.68YY25 pKa = 11.21DD26 pKa = 4.99DD27 pKa = 3.56VTKK30 pKa = 10.94EE31 pKa = 3.94EE32 pKa = 4.32LKK34 pKa = 11.08EE35 pKa = 4.12GVDD38 pKa = 3.73NNLITPEE45 pKa = 3.98QYY47 pKa = 10.35QEE49 pKa = 4.17IVGEE53 pKa = 4.44AYY55 pKa = 9.72TSVTLSTEE63 pKa = 3.68
Molecular weight: 7.31 kDa
Isoelectric point according different methods:
Protein with the highest isoelectric point:
>tr|O64082|O64082_BPSPB Uncharacterized protein yonV OS=Bacillus phage SPbeta OX=66797 GN=yonV PE=4 SV=1
MM1 pKa = 7.43LEE3 pKa = 3.73KK4 pKa = 10.15MGIVVAFLISLTVLTINSLTIVEE27 pKa = 4.5KK28 pKa = 10.96VRR30 pKa = 11.84NLKK33 pKa = 10.62NGTSKK38 pKa = 10.51KK39 pKa = 9.76KK40 pKa = 9.88KK41 pKa = 9.54RR42 pKa = 11.84IRR44 pKa = 11.84KK45 pKa = 8.26RR46 pKa = 11.84LRR48 pKa = 11.84PKK50 pKa = 10.01RR51 pKa = 11.84QRR53 pKa = 11.84QRR55 pKa = 11.84IRR57 pKa = 11.84RR58 pKa = 3.78
MM1 pKa = 7.43LEE3 pKa = 3.73KK4 pKa = 10.15MGIVVAFLISLTVLTINSLTIVEE27 pKa = 4.5KK28 pKa = 10.96VRR30 pKa = 11.84NLKK33 pKa = 10.62NGTSKK38 pKa = 10.51KK39 pKa = 9.76KK40 pKa = 9.88KK41 pKa = 9.54RR42 pKa = 11.84IRR44 pKa = 11.84KK45 pKa = 8.26RR46 pKa = 11.84LRR48 pKa = 11.84PKK50 pKa = 10.01RR51 pKa = 11.84QRR53 pKa = 11.84QRR55 pKa = 11.84IRR57 pKa = 11.84RR58 pKa = 3.78
Molecular weight: 6.91 kDa
Isoelectric point according different methods:
Peptides (in silico digests for buttom-up proteomics)
Below you can find in silico digests of the whole proteome with Trypsin, Chymotrypsin, Trypsin+LysC, LysN, ArgC proteases suitable for different mass spec machines.| Try ESI |
 |
|---|
| ChTry ESI |
|
|---|
| ArgC ESI |
|
|---|
| LysN ESI |
|
|---|
| TryLysC ESI |
|
|---|
| Try MALDI |
|
|---|
| ChTry MALDI |
|
|---|
| ArgC MALDI |
|
|---|
| LysN MALDI |
|
|---|
| TryLysC MALDI |
|
|---|
| Try LTQ |
|
|---|
| ChTry LTQ |
|
|---|
| ArgC LTQ |
|
|---|
| LysN LTQ |
|
|---|
| TryLysC LTQ |
|
|---|
| Try MSlow |
|
|---|
| ChTry MSlow |
|
|---|
| ArgC MSlow |
|
|---|
| LysN MSlow |
|
|---|
| TryLysC MSlow |
|
|---|
| Try MShigh |
|
|---|
| ChTry MShigh |
|
|---|
| ArgC MShigh |
|
|---|
| LysN MShigh |
|
|---|
| TryLysC MShigh |
|
|---|
General Statistics
Number of major isoforms |
Number of additional isoforms |
Number of all proteins |
Number of amino acids |
Min. Seq. Length |
Max. Seq. Length |
Avg. Seq. Length |
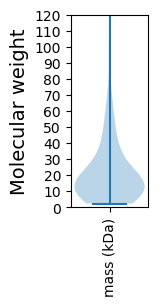
Avg. Mol. Weight |
|---|---|---|---|---|---|---|---|
0 |
38336 |
21 |
2285 |
207.2 |
23.78 |
Amino acid frequency
Ala |
Cys |
Asp |
Glu |
Phe |
Gly |
His |
Ile |
Lys |
Leu |
|---|---|---|---|---|---|---|---|---|---|
5.008 ± 0.275 | 0.976 ± 0.094 |
6.211 ± 0.133 | 8.058 ± 0.235 |
4.333 ± 0.182 | 5.402 ± 0.155 |
1.839 ± 0.134 | 7.612 ± 0.188 |
9.625 ± 0.216 | 8.78 ± 0.207 |
Met |
Asn |
Gln |
Pro |
Arg |
Ser |
Thr |
Val |
Trp |
Tyr |
|---|---|---|---|---|---|---|---|---|---|
2.355 ± 0.09 | 6.195 ± 0.153 |
2.64 ± 0.122 | 3.574 ± 0.259 |
3.673 ± 0.15 | 6.751 ± 0.224 |
5.368 ± 0.164 | 5.971 ± 0.161 |
1.054 ± 0.084 | 4.575 ± 0.139 |
Most of the basic statistics you can see at this page can be downloaded from this CSV file
See this proteome in:

Proteome-pI is available under Creative Commons Attribution-NoDerivs license, for more details see here
| Reference: Kozlowski LP. Proteome-pI 2.0: Proteome Isoelectric Point Database Update. Nucleic Acids Res. 2021, doi: 10.1093/nar/gkab944 | Contact: Lukasz P. Kozlowski |