Arsenicicoccus sp. MKL-02
Taxonomy: cellular organisms; Bacteria; Terrabacteria group; Actinobacteria; Actinomycetia; Micrococcales; Intrasporangiaceae; Arsenicicoccus; unclassified Arsenicicoccus
Average proteome isoelectric point is 6.35
Get precalculated fractions of proteins
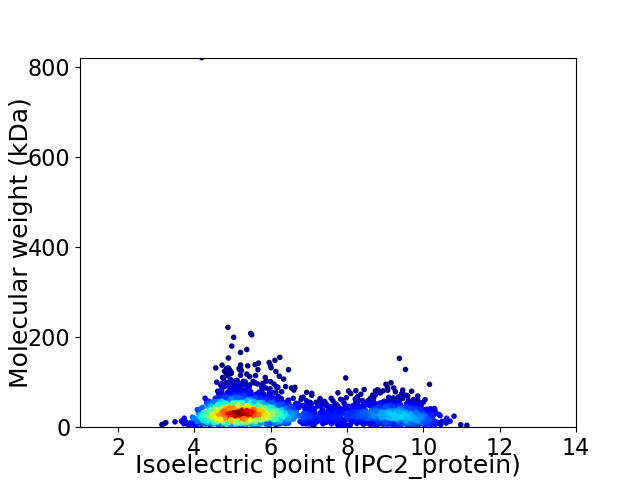
Virtual 2D-PAGE plot for 3030 proteins (isoelectric point calculated using IPC2_protein)
Get csv file with sequences according to given criteria:
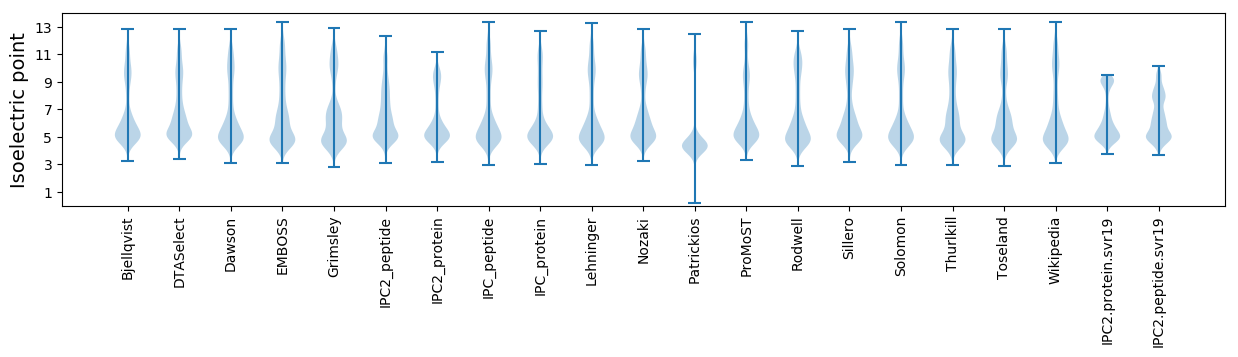
* You can choose from 21 different methods for calculating isoelectric point
Summary statistics related to proteome-wise predictions
Protein with the lowest isoelectric point:
>tr|A0A6I3IWB5|A0A6I3IWB5_9MICO Rrf2 family transcriptional regulator OS=Arsenicicoccus sp. MKL-02 OX=2663847 GN=GGG17_04035 PE=4 SV=1
MM1 pKa = 7.23SQTTTITVSGMTCGHH16 pKa = 6.36CTSAVTSEE24 pKa = 4.05LKK26 pKa = 10.19EE27 pKa = 4.13VQGVTDD33 pKa = 3.5VQIDD37 pKa = 4.02LVAGGDD43 pKa = 3.81SPVTITSEE51 pKa = 4.53SPVDD55 pKa = 3.41PAAIEE60 pKa = 4.06AAVDD64 pKa = 3.34EE65 pKa = 4.72AGYY68 pKa = 8.33TVVKK72 pKa = 10.73
MM1 pKa = 7.23SQTTTITVSGMTCGHH16 pKa = 6.36CTSAVTSEE24 pKa = 4.05LKK26 pKa = 10.19EE27 pKa = 4.13VQGVTDD33 pKa = 3.5VQIDD37 pKa = 4.02LVAGGDD43 pKa = 3.81SPVTITSEE51 pKa = 4.53SPVDD55 pKa = 3.41PAAIEE60 pKa = 4.06AAVDD64 pKa = 3.34EE65 pKa = 4.72AGYY68 pKa = 8.33TVVKK72 pKa = 10.73
Molecular weight: 7.27 kDa
Isoelectric point according different methods:
Protein with the highest isoelectric point:
>tr|A0A6I3ITJ4|A0A6I3ITJ4_9MICO Uncharacterized protein (Fragment) OS=Arsenicicoccus sp. MKL-02 OX=2663847 GN=GGG17_15080 PE=4 SV=1
MM1 pKa = 7.4GSVIKK6 pKa = 10.42KK7 pKa = 8.47RR8 pKa = 11.84RR9 pKa = 11.84KK10 pKa = 9.22RR11 pKa = 11.84MAKK14 pKa = 9.41KK15 pKa = 9.87KK16 pKa = 9.7HH17 pKa = 5.84RR18 pKa = 11.84KK19 pKa = 8.56LLRR22 pKa = 11.84KK23 pKa = 7.78TRR25 pKa = 11.84HH26 pKa = 3.65QRR28 pKa = 11.84RR29 pKa = 11.84NKK31 pKa = 9.78KK32 pKa = 9.85
MM1 pKa = 7.4GSVIKK6 pKa = 10.42KK7 pKa = 8.47RR8 pKa = 11.84RR9 pKa = 11.84KK10 pKa = 9.22RR11 pKa = 11.84MAKK14 pKa = 9.41KK15 pKa = 9.87KK16 pKa = 9.7HH17 pKa = 5.84RR18 pKa = 11.84KK19 pKa = 8.56LLRR22 pKa = 11.84KK23 pKa = 7.78TRR25 pKa = 11.84HH26 pKa = 3.65QRR28 pKa = 11.84RR29 pKa = 11.84NKK31 pKa = 9.78KK32 pKa = 9.85
Molecular weight: 4.08 kDa
Isoelectric point according different methods:
Peptides (in silico digests for buttom-up proteomics)
Below you can find in silico digests of the whole proteome with Trypsin, Chymotrypsin, Trypsin+LysC, LysN, ArgC proteases suitable for different mass spec machines.| Try ESI |
 |
|---|
| ChTry ESI |
|
|---|
| ArgC ESI |
|
|---|
| LysN ESI |
|
|---|
| TryLysC ESI |
|
|---|
| Try MALDI |
|
|---|
| ChTry MALDI |
|
|---|
| ArgC MALDI |
|
|---|
| LysN MALDI |
|
|---|
| TryLysC MALDI |
|
|---|
| Try LTQ |
|
|---|
| ChTry LTQ |
|
|---|
| ArgC LTQ |
|
|---|
| LysN LTQ |
|
|---|
| TryLysC LTQ |
|
|---|
| Try MSlow |
|
|---|
| ChTry MSlow |
|
|---|
| ArgC MSlow |
|
|---|
| LysN MSlow |
|
|---|
| TryLysC MSlow |
|
|---|
| Try MShigh |
|
|---|
| ChTry MShigh |
|
|---|
| ArgC MShigh |
|
|---|
| LysN MShigh |
|
|---|
| TryLysC MShigh |
|
|---|
General Statistics
Number of major isoforms |
Number of additional isoforms |
Number of all proteins |
Number of amino acids |
Min. Seq. Length |
Max. Seq. Length |
Avg. Seq. Length |
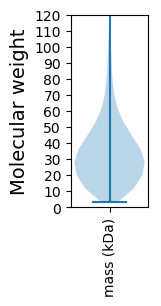
Avg. Mol. Weight |
|---|---|---|---|---|---|---|---|
0 |
1004058 |
31 |
8153 |
331.4 |
35.47 |
Amino acid frequency
Ala |
Cys |
Asp |
Glu |
Phe |
Gly |
His |
Ile |
Lys |
Leu |
|---|---|---|---|---|---|---|---|---|---|
13.106 ± 0.049 | 0.787 ± 0.012 |
6.343 ± 0.042 | 5.425 ± 0.054 |
2.433 ± 0.029 | 9.352 ± 0.041 |
2.347 ± 0.022 | 3.294 ± 0.032 |
1.885 ± 0.035 | 10.216 ± 0.058 |
Met |
Asn |
Gln |
Pro |
Arg |
Ser |
Thr |
Val |
Trp |
Tyr |
|---|---|---|---|---|---|---|---|---|---|
1.896 ± 0.022 | 1.559 ± 0.036 |
5.758 ± 0.036 | 3.014 ± 0.02 |
8.1 ± 0.066 | 5.216 ± 0.031 |
6.301 ± 0.095 | 9.498 ± 0.051 |
1.511 ± 0.022 | 1.959 ± 0.024 |
Most of the basic statistics you can see at this page can be downloaded from this CSV file
See this proteome in:

Proteome-pI is available under Creative Commons Attribution-NoDerivs license, for more details see here
| Reference: Kozlowski LP. Proteome-pI 2.0: Proteome Isoelectric Point Database Update. Nucleic Acids Res. 2021, doi: 10.1093/nar/gkab944 | Contact: Lukasz P. Kozlowski |