Microbispora rosea
Taxonomy: cellular organisms; Bacteria; Terrabacteria group; Actinobacteria; Actinomycetia; Streptosporangiales; Streptosporangiaceae; Microbispora
Average proteome isoelectric point is 6.53
Get precalculated fractions of proteins
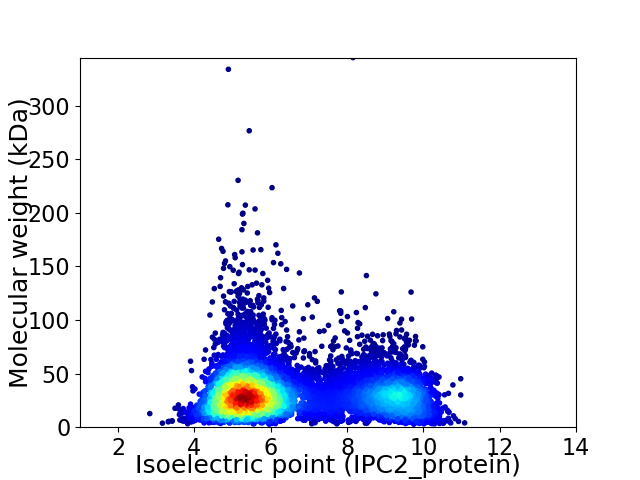
Virtual 2D-PAGE plot for 8224 proteins (isoelectric point calculated using IPC2_protein)
Get csv file with sequences according to given criteria:
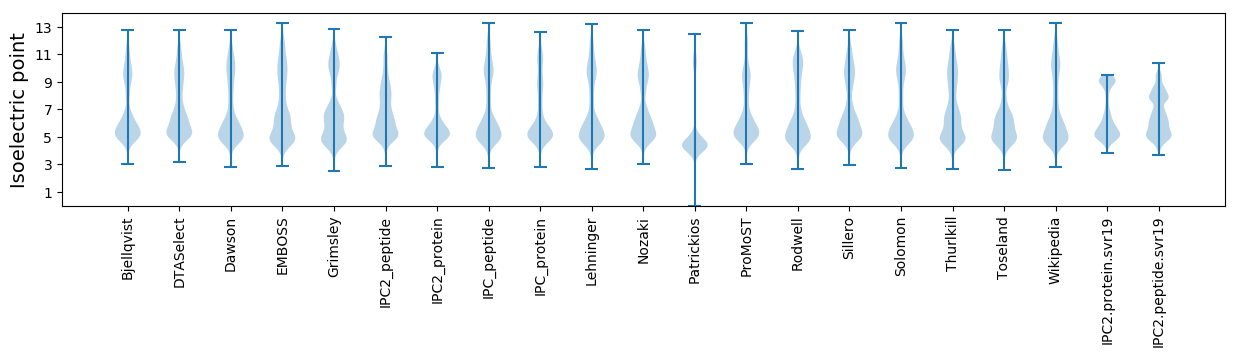
* You can choose from 21 different methods for calculating isoelectric point
Summary statistics related to proteome-wise predictions

Protein with the lowest isoelectric point:
>tr|A0A1N6R5A4|A0A1N6R5A4_9ACTN 1-acyl-sn-glycerol-3-phosphate acyltransferase OS=Microbispora rosea OX=58117 GN=SAMN05421833_101243 PE=4 SV=1
MM1 pKa = 6.71QTTDD5 pKa = 4.6LAKK8 pKa = 10.11AWKK11 pKa = 10.19DD12 pKa = 3.27PGFSATLTAEE22 pKa = 4.22QLSTLPANPVGDD34 pKa = 4.19LADD37 pKa = 3.54IADD40 pKa = 4.26FANEE44 pKa = 4.49GEE46 pKa = 4.45VQPIMMSWAPCWITWSSDD64 pKa = 3.64TNCCAYY70 pKa = 10.5
MM1 pKa = 6.71QTTDD5 pKa = 4.6LAKK8 pKa = 10.11AWKK11 pKa = 10.19DD12 pKa = 3.27PGFSATLTAEE22 pKa = 4.22QLSTLPANPVGDD34 pKa = 4.19LADD37 pKa = 3.54IADD40 pKa = 4.26FANEE44 pKa = 4.49GEE46 pKa = 4.45VQPIMMSWAPCWITWSSDD64 pKa = 3.64TNCCAYY70 pKa = 10.5
Molecular weight: 7.6 kDa
Isoelectric point according different methods:
Protein with the highest isoelectric point:
>tr|A0A1N7GAW6|A0A1N7GAW6_9ACTN Gas vesicle synthesis protein GvpO OS=Microbispora rosea OX=58117 GN=SAMN05421833_12742 PE=4 SV=1
MM1 pKa = 7.4GSVIKK6 pKa = 10.42KK7 pKa = 8.47RR8 pKa = 11.84RR9 pKa = 11.84KK10 pKa = 9.22RR11 pKa = 11.84MAKK14 pKa = 9.41KK15 pKa = 9.99KK16 pKa = 9.77HH17 pKa = 5.81RR18 pKa = 11.84KK19 pKa = 8.55LLKK22 pKa = 8.44KK23 pKa = 9.17TRR25 pKa = 11.84IQRR28 pKa = 11.84RR29 pKa = 11.84NKK31 pKa = 9.73KK32 pKa = 9.84
MM1 pKa = 7.4GSVIKK6 pKa = 10.42KK7 pKa = 8.47RR8 pKa = 11.84RR9 pKa = 11.84KK10 pKa = 9.22RR11 pKa = 11.84MAKK14 pKa = 9.41KK15 pKa = 9.99KK16 pKa = 9.77HH17 pKa = 5.81RR18 pKa = 11.84KK19 pKa = 8.55LLKK22 pKa = 8.44KK23 pKa = 9.17TRR25 pKa = 11.84IQRR28 pKa = 11.84RR29 pKa = 11.84NKK31 pKa = 9.73KK32 pKa = 9.84
Molecular weight: 4.03 kDa
Isoelectric point according different methods:
Peptides (in silico digests for buttom-up proteomics)
Below you can find in silico digests of the whole proteome with Trypsin, Chymotrypsin, Trypsin+LysC, LysN, ArgC proteases suitable for different mass spec machines.| Try ESI |
 |
|---|
| ChTry ESI |
|
|---|
| ArgC ESI |
|
|---|
| LysN ESI |
|
|---|
| TryLysC ESI |
|
|---|
| Try MALDI |
|
|---|
| ChTry MALDI |
|
|---|
| ArgC MALDI |
|
|---|
| LysN MALDI |
|
|---|
| TryLysC MALDI |
|
|---|
| Try LTQ |
|
|---|
| ChTry LTQ |
|
|---|
| ArgC LTQ |
|
|---|
| LysN LTQ |
|
|---|
| TryLysC LTQ |
|
|---|
| Try MSlow |
|
|---|
| ChTry MSlow |
|
|---|
| ArgC MSlow |
|
|---|
| LysN MSlow |
|
|---|
| TryLysC MSlow |
|
|---|
| Try MShigh |
|
|---|
| ChTry MShigh |
|
|---|
| ArgC MShigh |
|
|---|
| LysN MShigh |
|
|---|
| TryLysC MShigh |
|
|---|
General Statistics
Number of major isoforms |
Number of additional isoforms |
Number of all proteins |
Number of amino acids |
Min. Seq. Length |
Max. Seq. Length |
Avg. Seq. Length |
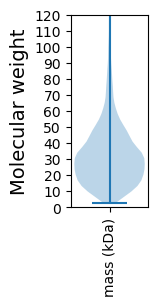
Avg. Mol. Weight |
|---|---|---|---|---|---|---|---|
0 |
2616702 |
26 |
3311 |
318.2 |
34.09 |
Amino acid frequency
Ala |
Cys |
Asp |
Glu |
Phe |
Gly |
His |
Ile |
Lys |
Leu |
|---|---|---|---|---|---|---|---|---|---|
13.537 ± 0.045 | 0.796 ± 0.008 |
5.808 ± 0.024 | 5.57 ± 0.027 |
2.775 ± 0.016 | 9.542 ± 0.024 |
2.17 ± 0.015 | 3.432 ± 0.017 |
1.91 ± 0.02 | 10.391 ± 0.034 |
Met |
Asn |
Gln |
Pro |
Arg |
Ser |
Thr |
Val |
Trp |
Tyr |
|---|---|---|---|---|---|---|---|---|---|
1.857 ± 0.008 | 1.794 ± 0.017 |
6.133 ± 0.025 | 2.566 ± 0.015 |
8.387 ± 0.036 | 5.032 ± 0.024 |
5.84 ± 0.023 | 8.774 ± 0.027 |
1.564 ± 0.014 | 2.121 ± 0.015 |
Most of the basic statistics you can see at this page can be downloaded from this CSV file
See this proteome in:

Proteome-pI is available under Creative Commons Attribution-NoDerivs license, for more details see here
| Reference: Kozlowski LP. Proteome-pI 2.0: Proteome Isoelectric Point Database Update. Nucleic Acids Res. 2021, doi: 10.1093/nar/gkab944 | Contact: Lukasz P. Kozlowski |