Wenling hepe-like virus 1
Taxonomy: Viruses; Riboviria; unclassified Riboviria; unclassified RNA viruses ShiM-2016
Average proteome isoelectric point is 6.14
Get precalculated fractions of proteins
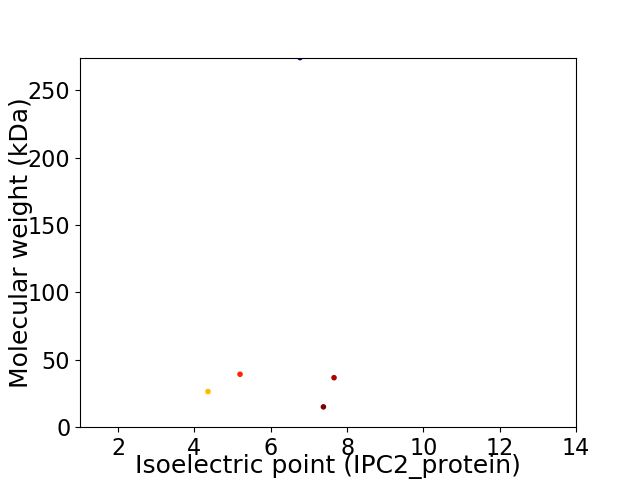
Virtual 2D-PAGE plot for 5 proteins (isoelectric point calculated using IPC2_protein)
Get csv file with sequences according to given criteria:
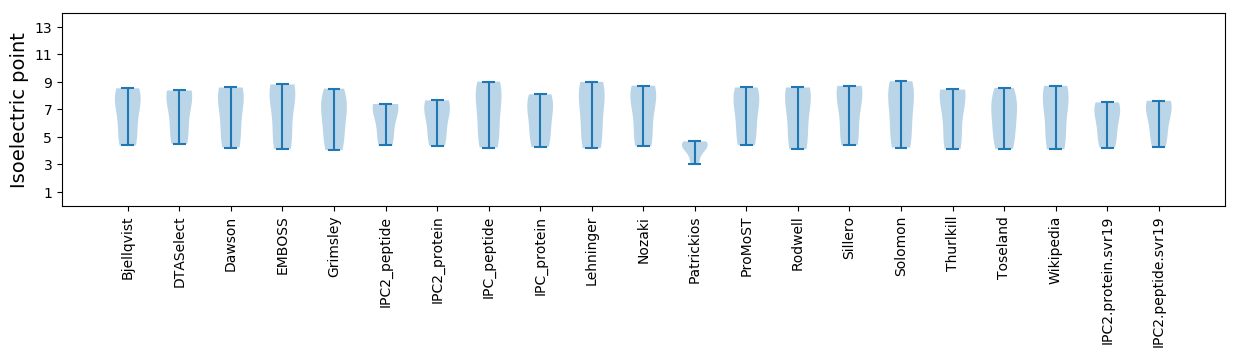
* You can choose from 21 different methods for calculating isoelectric point
Summary statistics related to proteome-wise predictions
Protein with the lowest isoelectric point:
>tr|A0A1L3KKJ2|A0A1L3KKJ2_9VIRU Putative structural protein OS=Wenling hepe-like virus 1 OX=1923493 PE=4 SV=1
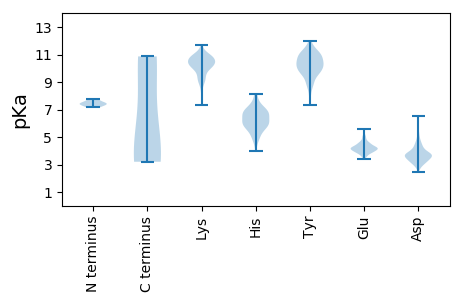
MM1 pKa = 7.46SIISRR6 pKa = 11.84AQVRR10 pKa = 11.84ITNTQWSYY18 pKa = 11.55LVDD21 pKa = 3.47YY22 pKa = 10.78FNFFTVGLYY31 pKa = 10.78GLLVAYY37 pKa = 10.07LSSIAYY43 pKa = 8.88NQFTINQSIIDD54 pKa = 4.23SRR56 pKa = 11.84NMILEE61 pKa = 4.06KK62 pKa = 10.29MEE64 pKa = 4.21LQHH67 pKa = 7.0NITIDD72 pKa = 3.05IYY74 pKa = 8.99NQSAEE79 pKa = 3.81FHH81 pKa = 6.69RR82 pKa = 11.84NILEE86 pKa = 4.72AISEE90 pKa = 4.21QTSLINQTGITINEE104 pKa = 4.16NLVKK108 pKa = 10.13QHH110 pKa = 6.54NISEE114 pKa = 4.74TILEE118 pKa = 4.15QNIGAFEE125 pKa = 4.24EE126 pKa = 4.2NLVLFDD132 pKa = 6.53KK133 pKa = 10.99IILTLNDD140 pKa = 3.59TLKK143 pKa = 10.9EE144 pKa = 3.84LVSFNQSSGVNFNSVIYY161 pKa = 9.37NQEE164 pKa = 3.56RR165 pKa = 11.84VLQFLGDD172 pKa = 4.34DD173 pKa = 3.01IGKK176 pKa = 9.77YY177 pKa = 9.56VLNLLNDD184 pKa = 3.82HH185 pKa = 6.64VDD187 pKa = 3.88SILTAEE193 pKa = 4.3VNSADD198 pKa = 3.92FLGDD202 pKa = 3.22VCEE205 pKa = 4.26YY206 pKa = 11.01DD207 pKa = 3.53PAGLGPINCEE217 pKa = 3.57STQLVRR223 pKa = 11.84QRR225 pKa = 11.84MVEE228 pKa = 3.98PEE230 pKa = 3.98FQQ232 pKa = 3.2
MM1 pKa = 7.46SIISRR6 pKa = 11.84AQVRR10 pKa = 11.84ITNTQWSYY18 pKa = 11.55LVDD21 pKa = 3.47YY22 pKa = 10.78FNFFTVGLYY31 pKa = 10.78GLLVAYY37 pKa = 10.07LSSIAYY43 pKa = 8.88NQFTINQSIIDD54 pKa = 4.23SRR56 pKa = 11.84NMILEE61 pKa = 4.06KK62 pKa = 10.29MEE64 pKa = 4.21LQHH67 pKa = 7.0NITIDD72 pKa = 3.05IYY74 pKa = 8.99NQSAEE79 pKa = 3.81FHH81 pKa = 6.69RR82 pKa = 11.84NILEE86 pKa = 4.72AISEE90 pKa = 4.21QTSLINQTGITINEE104 pKa = 4.16NLVKK108 pKa = 10.13QHH110 pKa = 6.54NISEE114 pKa = 4.74TILEE118 pKa = 4.15QNIGAFEE125 pKa = 4.24EE126 pKa = 4.2NLVLFDD132 pKa = 6.53KK133 pKa = 10.99IILTLNDD140 pKa = 3.59TLKK143 pKa = 10.9EE144 pKa = 3.84LVSFNQSSGVNFNSVIYY161 pKa = 9.37NQEE164 pKa = 3.56RR165 pKa = 11.84VLQFLGDD172 pKa = 4.34DD173 pKa = 3.01IGKK176 pKa = 9.77YY177 pKa = 9.56VLNLLNDD184 pKa = 3.82HH185 pKa = 6.64VDD187 pKa = 3.88SILTAEE193 pKa = 4.3VNSADD198 pKa = 3.92FLGDD202 pKa = 3.22VCEE205 pKa = 4.26YY206 pKa = 11.01DD207 pKa = 3.53PAGLGPINCEE217 pKa = 3.57STQLVRR223 pKa = 11.84QRR225 pKa = 11.84MVEE228 pKa = 3.98PEE230 pKa = 3.98FQQ232 pKa = 3.2
Molecular weight: 26.44 kDa
Isoelectric point according different methods:
Protein with the highest isoelectric point:
>tr|A0A1L3KKC2|A0A1L3KKC2_9VIRU Uncharacterized protein OS=Wenling hepe-like virus 1 OX=1923493 PE=4 SV=1
MM1 pKa = 7.39EE2 pKa = 5.15NKK4 pKa = 9.57LVKK7 pKa = 10.44LEE9 pKa = 3.96RR10 pKa = 11.84ANIIEE15 pKa = 4.2DD16 pKa = 3.81LVRR19 pKa = 11.84DD20 pKa = 3.98FDD22 pKa = 4.43FKK24 pKa = 11.55LFGKK28 pKa = 9.85QKK30 pKa = 9.07QDD32 pKa = 2.75MYY34 pKa = 11.1RR35 pKa = 11.84RR36 pKa = 11.84TIRR39 pKa = 11.84FFMEE43 pKa = 5.58GIDD46 pKa = 3.32HH47 pKa = 7.33AYY49 pKa = 8.83YY50 pKa = 10.75SRR52 pKa = 11.84WHH54 pKa = 5.1TTKK57 pKa = 10.68SDD59 pKa = 3.72AKK61 pKa = 11.06DD62 pKa = 3.35DD63 pKa = 4.02MANVLANITLPDD75 pKa = 3.51VPRR78 pKa = 11.84NPEE81 pKa = 3.88PFRR84 pKa = 11.84VTVDD88 pKa = 3.16YY89 pKa = 11.15DD90 pKa = 3.7DD91 pKa = 4.63EE92 pKa = 4.84GFHH95 pKa = 7.05IVGPNQRR102 pKa = 11.84VRR104 pKa = 11.84NVTLKK109 pKa = 10.25MNVGKK114 pKa = 10.31AISEE118 pKa = 3.89MAYY121 pKa = 10.06QSRR124 pKa = 11.84HH125 pKa = 4.73FYY127 pKa = 10.86
MM1 pKa = 7.39EE2 pKa = 5.15NKK4 pKa = 9.57LVKK7 pKa = 10.44LEE9 pKa = 3.96RR10 pKa = 11.84ANIIEE15 pKa = 4.2DD16 pKa = 3.81LVRR19 pKa = 11.84DD20 pKa = 3.98FDD22 pKa = 4.43FKK24 pKa = 11.55LFGKK28 pKa = 9.85QKK30 pKa = 9.07QDD32 pKa = 2.75MYY34 pKa = 11.1RR35 pKa = 11.84RR36 pKa = 11.84TIRR39 pKa = 11.84FFMEE43 pKa = 5.58GIDD46 pKa = 3.32HH47 pKa = 7.33AYY49 pKa = 8.83YY50 pKa = 10.75SRR52 pKa = 11.84WHH54 pKa = 5.1TTKK57 pKa = 10.68SDD59 pKa = 3.72AKK61 pKa = 11.06DD62 pKa = 3.35DD63 pKa = 4.02MANVLANITLPDD75 pKa = 3.51VPRR78 pKa = 11.84NPEE81 pKa = 3.88PFRR84 pKa = 11.84VTVDD88 pKa = 3.16YY89 pKa = 11.15DD90 pKa = 3.7DD91 pKa = 4.63EE92 pKa = 4.84GFHH95 pKa = 7.05IVGPNQRR102 pKa = 11.84VRR104 pKa = 11.84NVTLKK109 pKa = 10.25MNVGKK114 pKa = 10.31AISEE118 pKa = 3.89MAYY121 pKa = 10.06QSRR124 pKa = 11.84HH125 pKa = 4.73FYY127 pKa = 10.86
Molecular weight: 15.08 kDa
Isoelectric point according different methods:
Peptides (in silico digests for buttom-up proteomics)
Below you can find in silico digests of the whole proteome with Trypsin, Chymotrypsin, Trypsin+LysC, LysN, ArgC proteases suitable for different mass spec machines.| Try ESI |
 |
|---|
| ChTry ESI |
|
|---|
| ArgC ESI |
|
|---|
| LysN ESI |
|
|---|
| TryLysC ESI |
|
|---|
| Try MALDI |
|
|---|
| ChTry MALDI |
|
|---|
| ArgC MALDI |
|
|---|
| LysN MALDI |
|
|---|
| TryLysC MALDI |
|
|---|
| Try LTQ |
|
|---|
| ChTry LTQ |
|
|---|
| ArgC LTQ |
|
|---|
| LysN LTQ |
|
|---|
| TryLysC LTQ |
|
|---|
| Try MSlow |
|
|---|
| ChTry MSlow |
|
|---|
| ArgC MSlow |
|
|---|
| LysN MSlow |
|
|---|
| TryLysC MSlow |
|
|---|
| Try MShigh |
|
|---|
| ChTry MShigh |
|
|---|
| ArgC MShigh |
|
|---|
| LysN MShigh |
|
|---|
| TryLysC MShigh |
|
|---|
General Statistics
Number of major isoforms |
Number of additional isoforms |
Number of all proteins |
Number of amino acids |
Min. Seq. Length |
Max. Seq. Length |
Avg. Seq. Length |
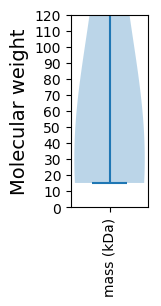
Avg. Mol. Weight |
|---|---|---|---|---|---|---|---|
0 |
3458 |
127 |
2419 |
691.6 |
78.36 |
Amino acid frequency
Ala |
Cys |
Asp |
Glu |
Phe |
Gly |
His |
Ile |
Lys |
Leu |
|---|---|---|---|---|---|---|---|---|---|
5.986 ± 0.524 | 1.388 ± 0.423 |
5.928 ± 0.344 | 6.449 ± 0.622 |
4.772 ± 0.328 | 4.945 ± 0.3 |
2.371 ± 0.301 | 6.333 ± 0.781 |
7.548 ± 1.38 | 8.386 ± 0.681 |
Met |
Asn |
Gln |
Pro |
Arg |
Ser |
Thr |
Val |
Trp |
Tyr |
|---|---|---|---|---|---|---|---|---|---|
2.285 ± 0.298 | 5.639 ± 1.06 |
4.482 ± 0.724 | 4.28 ± 0.48 |
4.222 ± 0.379 | 6.709 ± 0.389 |
7.345 ± 0.472 | 6.449 ± 0.336 |
0.781 ± 0.194 | 3.702 ± 0.243 |
Most of the basic statistics you can see at this page can be downloaded from this CSV file
See this proteome in:

Proteome-pI is available under Creative Commons Attribution-NoDerivs license, for more details see here
| Reference: Kozlowski LP. Proteome-pI 2.0: Proteome Isoelectric Point Database Update. Nucleic Acids Res. 2021, doi: 10.1093/nar/gkab944 | Contact: Lukasz P. Kozlowski |