Elderberry carlavirus C
Taxonomy: Viruses; Riboviria; Orthornavirae; Kitrinoviricota; Alsuviricetes; Tymovirales; Betaflexiviridae; Quinvirinae; Carlavirus; Sambucus virus C
Average proteome isoelectric point is 7.01
Get precalculated fractions of proteins
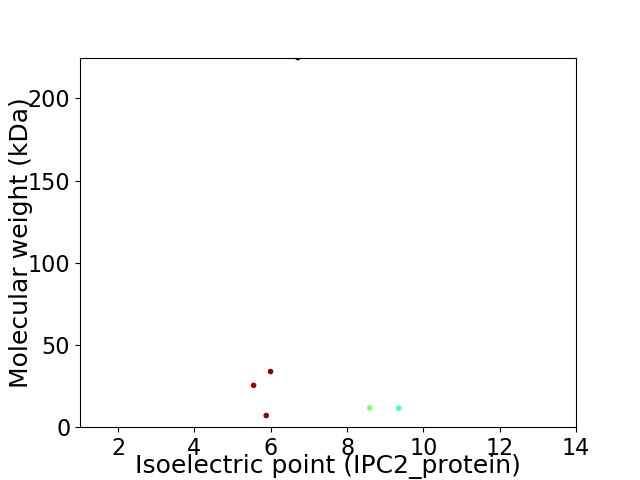
Virtual 2D-PAGE plot for 6 proteins (isoelectric point calculated using IPC2_protein)
Get csv file with sequences according to given criteria:
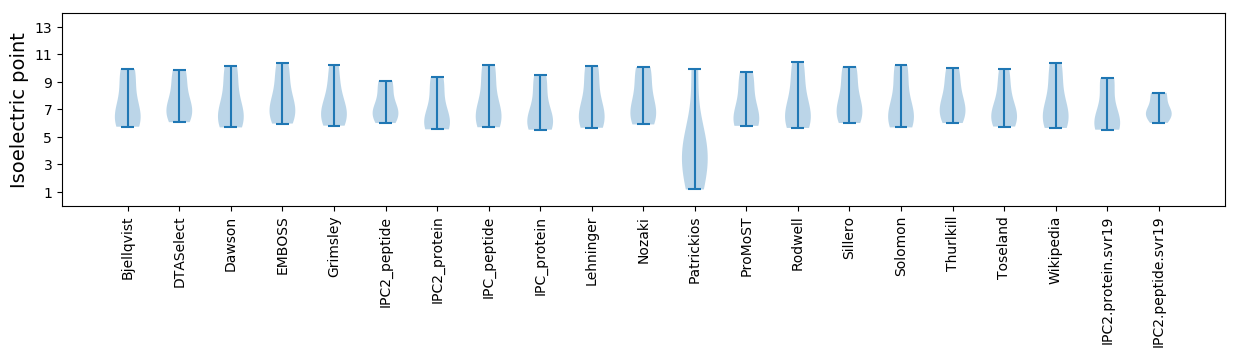
* You can choose from 21 different methods for calculating isoelectric point
Summary statistics related to proteome-wise predictions
Protein with the lowest isoelectric point:
>tr|A0A0A7MB61|A0A0A7MB61_9VIRU Helicase OS=Elderberry carlavirus C OX=1569054 PE=3 SV=1
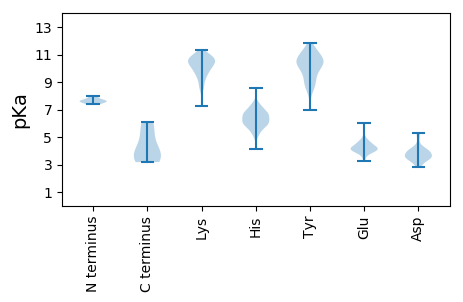
MM1 pKa = 7.61EE2 pKa = 5.1IVLEE6 pKa = 4.18EE7 pKa = 4.17ADD9 pKa = 3.46LAGFEE14 pKa = 4.19RR15 pKa = 11.84TNLKK19 pKa = 10.17LSKK22 pKa = 9.93PLVFHH27 pKa = 6.58CVPGAGKK34 pKa = 8.5STFIRR39 pKa = 11.84HH40 pKa = 5.82LLGLSSRR47 pKa = 11.84FEE49 pKa = 4.32AFTHH53 pKa = 6.64GAADD57 pKa = 3.69PRR59 pKa = 11.84KK60 pKa = 9.85LDD62 pKa = 3.32GRR64 pKa = 11.84RR65 pKa = 11.84IKK67 pKa = 10.38PVSEE71 pKa = 5.01LEE73 pKa = 4.23AADD76 pKa = 3.77QNSLVLIDD84 pKa = 4.79EE85 pKa = 4.55YY86 pKa = 11.56CSGEE90 pKa = 4.28EE91 pKa = 3.87VSEE94 pKa = 3.96RR95 pKa = 11.84ALAVFGDD102 pKa = 4.26PLQSNTGPVLQPHH115 pKa = 5.98FVLNKK120 pKa = 9.11SRR122 pKa = 11.84RR123 pKa = 11.84FGAQTAALLKK133 pKa = 9.37TLGYY137 pKa = 10.44DD138 pKa = 3.59VEE140 pKa = 5.73AEE142 pKa = 3.86GDD144 pKa = 4.1DD145 pKa = 3.62NVKK148 pKa = 10.32ISDD151 pKa = 3.51IFKK154 pKa = 10.59AEE156 pKa = 3.97PEE158 pKa = 4.34GKK160 pKa = 9.58VICYY164 pKa = 8.61EE165 pKa = 4.13RR166 pKa = 11.84EE167 pKa = 3.89VAQLLRR173 pKa = 11.84RR174 pKa = 11.84HH175 pKa = 5.61GVDD178 pKa = 3.34YY179 pKa = 11.39LCANSVRR186 pKa = 11.84GSTFDD191 pKa = 3.31EE192 pKa = 4.96VCFVTAEE199 pKa = 4.25SEE201 pKa = 4.15PSDD204 pKa = 3.3RR205 pKa = 11.84ALAFVCLTRR214 pKa = 11.84HH215 pKa = 5.76RR216 pKa = 11.84KK217 pKa = 8.81KK218 pKa = 10.98LQILCPNATYY228 pKa = 10.9APAA231 pKa = 5.32
MM1 pKa = 7.61EE2 pKa = 5.1IVLEE6 pKa = 4.18EE7 pKa = 4.17ADD9 pKa = 3.46LAGFEE14 pKa = 4.19RR15 pKa = 11.84TNLKK19 pKa = 10.17LSKK22 pKa = 9.93PLVFHH27 pKa = 6.58CVPGAGKK34 pKa = 8.5STFIRR39 pKa = 11.84HH40 pKa = 5.82LLGLSSRR47 pKa = 11.84FEE49 pKa = 4.32AFTHH53 pKa = 6.64GAADD57 pKa = 3.69PRR59 pKa = 11.84KK60 pKa = 9.85LDD62 pKa = 3.32GRR64 pKa = 11.84RR65 pKa = 11.84IKK67 pKa = 10.38PVSEE71 pKa = 5.01LEE73 pKa = 4.23AADD76 pKa = 3.77QNSLVLIDD84 pKa = 4.79EE85 pKa = 4.55YY86 pKa = 11.56CSGEE90 pKa = 4.28EE91 pKa = 3.87VSEE94 pKa = 3.96RR95 pKa = 11.84ALAVFGDD102 pKa = 4.26PLQSNTGPVLQPHH115 pKa = 5.98FVLNKK120 pKa = 9.11SRR122 pKa = 11.84RR123 pKa = 11.84FGAQTAALLKK133 pKa = 9.37TLGYY137 pKa = 10.44DD138 pKa = 3.59VEE140 pKa = 5.73AEE142 pKa = 3.86GDD144 pKa = 4.1DD145 pKa = 3.62NVKK148 pKa = 10.32ISDD151 pKa = 3.51IFKK154 pKa = 10.59AEE156 pKa = 3.97PEE158 pKa = 4.34GKK160 pKa = 9.58VICYY164 pKa = 8.61EE165 pKa = 4.13RR166 pKa = 11.84EE167 pKa = 3.89VAQLLRR173 pKa = 11.84RR174 pKa = 11.84HH175 pKa = 5.61GVDD178 pKa = 3.34YY179 pKa = 11.39LCANSVRR186 pKa = 11.84GSTFDD191 pKa = 3.31EE192 pKa = 4.96VCFVTAEE199 pKa = 4.25SEE201 pKa = 4.15PSDD204 pKa = 3.3RR205 pKa = 11.84ALAFVCLTRR214 pKa = 11.84HH215 pKa = 5.76RR216 pKa = 11.84KK217 pKa = 8.81KK218 pKa = 10.98LQILCPNATYY228 pKa = 10.9APAA231 pKa = 5.32
Molecular weight: 25.47 kDa
Isoelectric point according different methods:
Protein with the highest isoelectric point:
>tr|A0A0A7MDT6|A0A0A7MDT6_9VIRU Capsid protein OS=Elderberry carlavirus C OX=1569054 PE=3 SV=1
MM1 pKa = 7.54GSDD4 pKa = 3.85RR5 pKa = 11.84LSTMYY10 pKa = 10.88LVLWKK15 pKa = 10.08LKK17 pKa = 10.36NVGSIDD23 pKa = 3.96LCVLILSLSKK33 pKa = 10.78PPLTLGGGSSSYY45 pKa = 10.66AKK47 pKa = 9.99KK48 pKa = 10.27RR49 pKa = 11.84RR50 pKa = 11.84AAKK53 pKa = 9.98IGRR56 pKa = 11.84CWRR59 pKa = 11.84CFRR62 pKa = 11.84VVPPPYY68 pKa = 9.71HH69 pKa = 6.4SKK71 pKa = 10.95CDD73 pKa = 3.46GRR75 pKa = 11.84TCRR78 pKa = 11.84PGISYY83 pKa = 9.84RR84 pKa = 11.84WEE86 pKa = 3.33IALYY90 pKa = 9.35ISRR93 pKa = 11.84GVTEE97 pKa = 5.16VIPLEE102 pKa = 4.18NN103 pKa = 3.53
MM1 pKa = 7.54GSDD4 pKa = 3.85RR5 pKa = 11.84LSTMYY10 pKa = 10.88LVLWKK15 pKa = 10.08LKK17 pKa = 10.36NVGSIDD23 pKa = 3.96LCVLILSLSKK33 pKa = 10.78PPLTLGGGSSSYY45 pKa = 10.66AKK47 pKa = 9.99KK48 pKa = 10.27RR49 pKa = 11.84RR50 pKa = 11.84AAKK53 pKa = 9.98IGRR56 pKa = 11.84CWRR59 pKa = 11.84CFRR62 pKa = 11.84VVPPPYY68 pKa = 9.71HH69 pKa = 6.4SKK71 pKa = 10.95CDD73 pKa = 3.46GRR75 pKa = 11.84TCRR78 pKa = 11.84PGISYY83 pKa = 9.84RR84 pKa = 11.84WEE86 pKa = 3.33IALYY90 pKa = 9.35ISRR93 pKa = 11.84GVTEE97 pKa = 5.16VIPLEE102 pKa = 4.18NN103 pKa = 3.53
Molecular weight: 11.56 kDa
Isoelectric point according different methods:
Peptides (in silico digests for buttom-up proteomics)
Below you can find in silico digests of the whole proteome with Trypsin, Chymotrypsin, Trypsin+LysC, LysN, ArgC proteases suitable for different mass spec machines.| Try ESI |
 |
|---|
| ChTry ESI |
|
|---|
| ArgC ESI |
|
|---|
| LysN ESI |
|
|---|
| TryLysC ESI |
|
|---|
| Try MALDI |
|
|---|
| ChTry MALDI |
|
|---|
| ArgC MALDI |
|
|---|
| LysN MALDI |
|
|---|
| TryLysC MALDI |
|
|---|
| Try LTQ |
|
|---|
| ChTry LTQ |
|
|---|
| ArgC LTQ |
|
|---|
| LysN LTQ |
|
|---|
| TryLysC LTQ |
|
|---|
| Try MSlow |
|
|---|
| ChTry MSlow |
|
|---|
| ArgC MSlow |
|
|---|
| LysN MSlow |
|
|---|
| TryLysC MSlow |
|
|---|
| Try MShigh |
|
|---|
| ChTry MShigh |
|
|---|
| ArgC MShigh |
|
|---|
| LysN MShigh |
|
|---|
| TryLysC MShigh |
|
|---|
General Statistics
Number of major isoforms |
Number of additional isoforms |
Number of all proteins |
Number of amino acids |
Min. Seq. Length |
Max. Seq. Length |
Avg. Seq. Length |
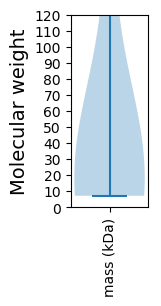
Avg. Mol. Weight |
|---|---|---|---|---|---|---|---|
0 |
2818 |
66 |
2005 |
469.7 |
52.43 |
Amino acid frequency
Ala |
Cys |
Asp |
Glu |
Phe |
Gly |
His |
Ile |
Lys |
Leu |
|---|---|---|---|---|---|---|---|---|---|
8.588 ± 0.714 | 2.697 ± 0.622 |
4.507 ± 0.556 | 7.062 ± 1.285 |
4.01 ± 0.83 | 6.352 ± 0.383 |
3.016 ± 0.305 | 5.287 ± 0.698 |
5.855 ± 0.805 | 10.256 ± 0.648 |
Met |
Asn |
Gln |
Pro |
Arg |
Ser |
Thr |
Val |
Trp |
Tyr |
|---|---|---|---|---|---|---|---|---|---|
1.916 ± 0.369 | 3.655 ± 0.338 |
4.684 ± 0.822 | 2.484 ± 0.333 |
5.997 ± 0.502 | 6.813 ± 0.456 |
5.678 ± 0.61 | 6.565 ± 0.73 |
0.923 ± 0.258 | 3.655 ± 0.333 |
Most of the basic statistics you can see at this page can be downloaded from this CSV file
See this proteome in:

Proteome-pI is available under Creative Commons Attribution-NoDerivs license, for more details see here
| Reference: Kozlowski LP. Proteome-pI 2.0: Proteome Isoelectric Point Database Update. Nucleic Acids Res. 2021, doi: 10.1093/nar/gkab944 | Contact: Lukasz P. Kozlowski |