Pseudomonas phage phiKZ
Taxonomy: Viruses; Duplodnaviria; Heunggongvirae; Uroviricota; Caudoviricetes; Caudovirales; Myoviridae; Phikzvirus
Average proteome isoelectric point is 6.24
Get precalculated fractions of proteins
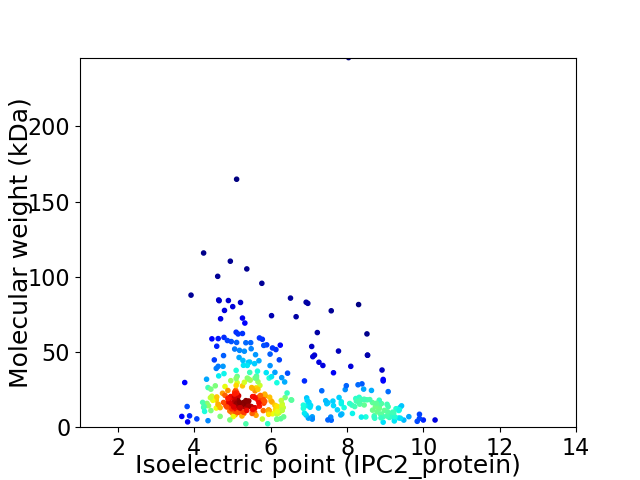
Virtual 2D-PAGE plot for 369 proteins (isoelectric point calculated using IPC2_protein)
Get csv file with sequences according to given criteria:
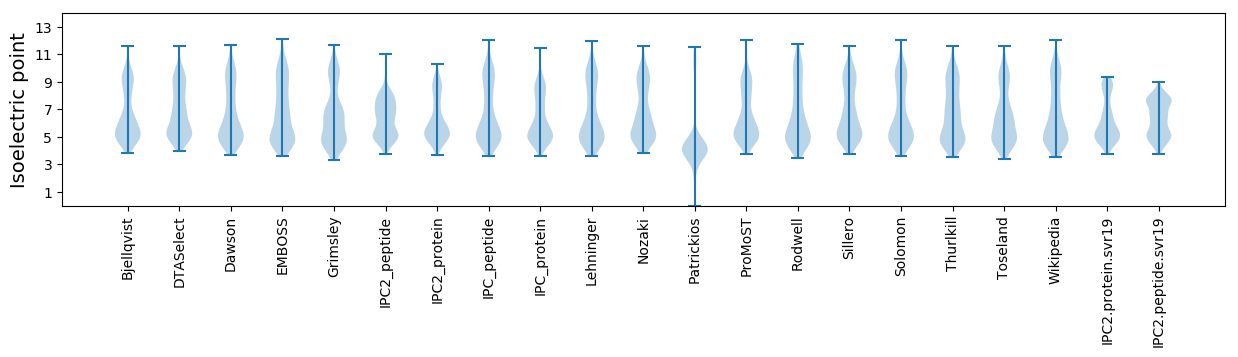
* You can choose from 21 different methods for calculating isoelectric point
Summary statistics related to proteome-wise predictions
Protein with the lowest isoelectric point:
>tr|L7SZ01|L7SZ01_BPDPK PHIKZ041.2 OS=Pseudomonas phage phiKZ OX=169683 PE=4 SV=1
MM1 pKa = 8.12DD2 pKa = 6.47LNPHH6 pKa = 7.16DD7 pKa = 5.43IDD9 pKa = 3.54NQAIFNYY16 pKa = 10.72LEE18 pKa = 4.09MLPSTFKK25 pKa = 9.6ITEE28 pKa = 4.27STFVAADD35 pKa = 3.7FDD37 pKa = 5.57SNGDD41 pKa = 3.59VIIQLEE47 pKa = 3.89QSLIYY52 pKa = 9.5TGCSLSKK59 pKa = 10.69FNACFNTMM67 pKa = 3.61
MM1 pKa = 8.12DD2 pKa = 6.47LNPHH6 pKa = 7.16DD7 pKa = 5.43IDD9 pKa = 3.54NQAIFNYY16 pKa = 10.72LEE18 pKa = 4.09MLPSTFKK25 pKa = 9.6ITEE28 pKa = 4.27STFVAADD35 pKa = 3.7FDD37 pKa = 5.57SNGDD41 pKa = 3.59VIIQLEE47 pKa = 3.89QSLIYY52 pKa = 9.5TGCSLSKK59 pKa = 10.69FNACFNTMM67 pKa = 3.61
Molecular weight: 7.54 kDa
Isoelectric point according different methods:
Protein with the highest isoelectric point:
>tr|Q8SCU5|Q8SCU5_BPDPK PHIKZ217 OS=Pseudomonas phage phiKZ OX=169683 PE=4 SV=2
MM1 pKa = 7.64FKK3 pKa = 10.66RR4 pKa = 11.84VMRR7 pKa = 11.84YY8 pKa = 9.04IRR10 pKa = 11.84VLKK13 pKa = 10.34LIVIFYY19 pKa = 9.96VRR21 pKa = 11.84RR22 pKa = 11.84QLGLHH27 pKa = 7.03DD28 pKa = 3.67YY29 pKa = 7.54CTRR32 pKa = 11.84KK33 pKa = 8.38NTIALDD39 pKa = 3.46RR40 pKa = 11.84EE41 pKa = 4.15NNKK44 pKa = 9.62RR45 pKa = 11.84VQINAISRR53 pKa = 11.84KK54 pKa = 9.01VEE56 pKa = 3.57EE57 pKa = 4.34ALFKK61 pKa = 11.16VEE63 pKa = 4.96LVAIMSKK70 pKa = 10.32RR71 pKa = 3.28
MM1 pKa = 7.64FKK3 pKa = 10.66RR4 pKa = 11.84VMRR7 pKa = 11.84YY8 pKa = 9.04IRR10 pKa = 11.84VLKK13 pKa = 10.34LIVIFYY19 pKa = 9.96VRR21 pKa = 11.84RR22 pKa = 11.84QLGLHH27 pKa = 7.03DD28 pKa = 3.67YY29 pKa = 7.54CTRR32 pKa = 11.84KK33 pKa = 8.38NTIALDD39 pKa = 3.46RR40 pKa = 11.84EE41 pKa = 4.15NNKK44 pKa = 9.62RR45 pKa = 11.84VQINAISRR53 pKa = 11.84KK54 pKa = 9.01VEE56 pKa = 3.57EE57 pKa = 4.34ALFKK61 pKa = 11.16VEE63 pKa = 4.96LVAIMSKK70 pKa = 10.32RR71 pKa = 3.28
Molecular weight: 8.6 kDa
Isoelectric point according different methods:
Peptides (in silico digests for buttom-up proteomics)
Below you can find in silico digests of the whole proteome with Trypsin, Chymotrypsin, Trypsin+LysC, LysN, ArgC proteases suitable for different mass spec machines.| Try ESI |
 |
|---|
| ChTry ESI |
|
|---|
| ArgC ESI |
|
|---|
| LysN ESI |
|
|---|
| TryLysC ESI |
|
|---|
| Try MALDI |
|
|---|
| ChTry MALDI |
|
|---|
| ArgC MALDI |
|
|---|
| LysN MALDI |
|
|---|
| TryLysC MALDI |
|
|---|
| Try LTQ |
|
|---|
| ChTry LTQ |
|
|---|
| ArgC LTQ |
|
|---|
| LysN LTQ |
|
|---|
| TryLysC LTQ |
|
|---|
| Try MSlow |
|
|---|
| ChTry MSlow |
|
|---|
| ArgC MSlow |
|
|---|
| LysN MSlow |
|
|---|
| TryLysC MSlow |
|
|---|
| Try MShigh |
|
|---|
| ChTry MShigh |
|
|---|
| ArgC MShigh |
|
|---|
| LysN MShigh |
|
|---|
| TryLysC MShigh |
|
|---|
General Statistics
Number of major isoforms |
Number of additional isoforms |
Number of all proteins |
Number of amino acids |
Min. Seq. Length |
Max. Seq. Length |
Avg. Seq. Length |
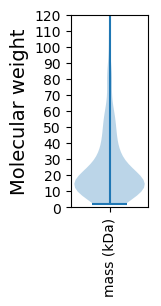
Avg. Mol. Weight |
|---|---|---|---|---|---|---|---|
0 |
85117 |
20 |
2237 |
230.7 |
26.21 |
Amino acid frequency
Ala |
Cys |
Asp |
Glu |
Phe |
Gly |
His |
Ile |
Lys |
Leu |
|---|---|---|---|---|---|---|---|---|---|
6.139 ± 0.155 | 0.992 ± 0.048 |
6.681 ± 0.083 | 6.358 ± 0.151 |
4.014 ± 0.071 | 5.635 ± 0.136 |
2.034 ± 0.075 | 7.379 ± 0.104 |
6.482 ± 0.132 | 8.459 ± 0.099 |
Met |
Asn |
Gln |
Pro |
Arg |
Ser |
Thr |
Val |
Trp |
Tyr |
|---|---|---|---|---|---|---|---|---|---|
2.709 ± 0.076 | 6.146 ± 0.107 |
4.019 ± 0.107 | 3.406 ± 0.089 |
4.717 ± 0.111 | 6.075 ± 0.107 |
6.254 ± 0.111 | 6.872 ± 0.113 |
1.299 ± 0.059 | 4.331 ± 0.117 |
Most of the basic statistics you can see at this page can be downloaded from this CSV file
See this proteome in:

Proteome-pI is available under Creative Commons Attribution-NoDerivs license, for more details see here
| Reference: Kozlowski LP. Proteome-pI 2.0: Proteome Isoelectric Point Database Update. Nucleic Acids Res. 2021, doi: 10.1093/nar/gkab944 | Contact: Lukasz P. Kozlowski |