Roseburia sp. CAG:182
Taxonomy: cellular organisms; Bacteria; Terrabacteria group; Firmicutes; Clostridia; Eubacteriales; Lachnospiraceae; Roseburia; environmental samples
Average proteome isoelectric point is 5.97
Get precalculated fractions of proteins
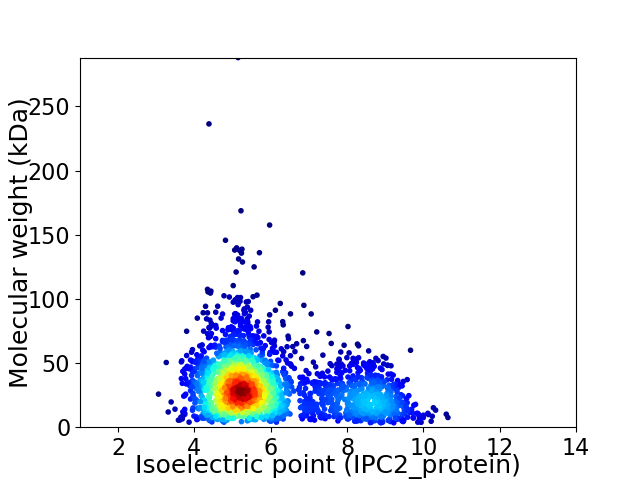
Virtual 2D-PAGE plot for 2523 proteins (isoelectric point calculated using IPC2_protein)
Get csv file with sequences according to given criteria:
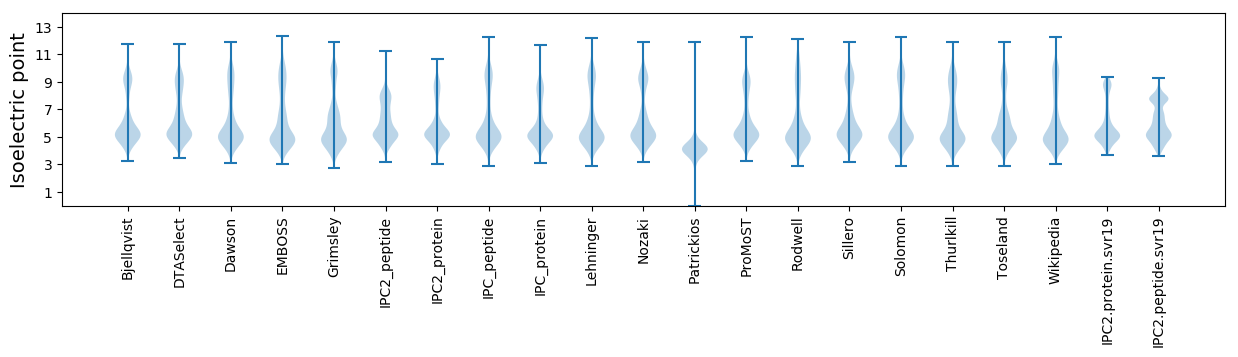
* You can choose from 21 different methods for calculating isoelectric point
Summary statistics related to proteome-wise predictions
Protein with the lowest isoelectric point:
>tr|R7QYR2|R7QYR2_9FIRM Transcriptional regulator GntR family OS=Roseburia sp. CAG:182 OX=1262942 GN=BN520_01922 PE=4 SV=1
MM1 pKa = 7.63LANDD5 pKa = 5.25NIPDD9 pKa = 3.88LVSANALSEE18 pKa = 4.38LGGTYY23 pKa = 10.29LDD25 pKa = 3.8QVKK28 pKa = 8.6STNSDD33 pKa = 3.79TIVTSVTYY41 pKa = 10.17KK42 pKa = 10.45DD43 pKa = 3.21SVYY46 pKa = 11.07AFPFTSNTWFMYY58 pKa = 9.22YY59 pKa = 10.33DD60 pKa = 3.42KK61 pKa = 11.38SVFTDD66 pKa = 3.66DD67 pKa = 5.39DD68 pKa = 3.7IKK70 pKa = 11.62SFDD73 pKa = 3.5TMLSKK78 pKa = 11.14GKK80 pKa = 10.7VSFPLSNSWYY90 pKa = 9.02IQAFYY95 pKa = 10.67AGNGCTLFGDD105 pKa = 4.5GTDD108 pKa = 3.45EE109 pKa = 4.56AAGIDD114 pKa = 3.9FGGDD118 pKa = 2.64KK119 pKa = 10.59AAAVTNYY126 pKa = 10.56LVDD129 pKa = 4.63LVANPNFINDD139 pKa = 3.28QDD141 pKa = 4.08GAGIAGLRR149 pKa = 11.84DD150 pKa = 3.41GSVNAIFSGSWDD162 pKa = 3.34AASVKK167 pKa = 10.06EE168 pKa = 4.3ALGDD172 pKa = 3.77NYY174 pKa = 10.59GVAALPTFTVDD185 pKa = 4.64GNEE188 pKa = 4.13CQMKK192 pKa = 10.43SFAGSKK198 pKa = 10.47AIGVNPNCEE207 pKa = 4.06NPQIAMSLAAYY218 pKa = 10.43LSGEE222 pKa = 4.44EE223 pKa = 4.14AQQAHH228 pKa = 5.74YY229 pKa = 10.34DD230 pKa = 3.64EE231 pKa = 6.11RR232 pKa = 11.84NILPSNTNITLADD245 pKa = 4.14DD246 pKa = 5.61PIATATADD254 pKa = 3.87VLDD257 pKa = 4.84HH258 pKa = 6.58CSIMQPIVSAMSNYY272 pKa = 8.63WSPAEE277 pKa = 4.03NMGKK281 pKa = 9.38NLIAGDD287 pKa = 3.9VTHH290 pKa = 7.57DD291 pKa = 3.41NAAEE295 pKa = 4.06KK296 pKa = 10.14TEE298 pKa = 4.06DD299 pKa = 3.71MNTAMNTDD307 pKa = 3.18VAADD311 pKa = 3.56AEE313 pKa = 4.57EE314 pKa = 4.17ATEE317 pKa = 3.94
MM1 pKa = 7.63LANDD5 pKa = 5.25NIPDD9 pKa = 3.88LVSANALSEE18 pKa = 4.38LGGTYY23 pKa = 10.29LDD25 pKa = 3.8QVKK28 pKa = 8.6STNSDD33 pKa = 3.79TIVTSVTYY41 pKa = 10.17KK42 pKa = 10.45DD43 pKa = 3.21SVYY46 pKa = 11.07AFPFTSNTWFMYY58 pKa = 9.22YY59 pKa = 10.33DD60 pKa = 3.42KK61 pKa = 11.38SVFTDD66 pKa = 3.66DD67 pKa = 5.39DD68 pKa = 3.7IKK70 pKa = 11.62SFDD73 pKa = 3.5TMLSKK78 pKa = 11.14GKK80 pKa = 10.7VSFPLSNSWYY90 pKa = 9.02IQAFYY95 pKa = 10.67AGNGCTLFGDD105 pKa = 4.5GTDD108 pKa = 3.45EE109 pKa = 4.56AAGIDD114 pKa = 3.9FGGDD118 pKa = 2.64KK119 pKa = 10.59AAAVTNYY126 pKa = 10.56LVDD129 pKa = 4.63LVANPNFINDD139 pKa = 3.28QDD141 pKa = 4.08GAGIAGLRR149 pKa = 11.84DD150 pKa = 3.41GSVNAIFSGSWDD162 pKa = 3.34AASVKK167 pKa = 10.06EE168 pKa = 4.3ALGDD172 pKa = 3.77NYY174 pKa = 10.59GVAALPTFTVDD185 pKa = 4.64GNEE188 pKa = 4.13CQMKK192 pKa = 10.43SFAGSKK198 pKa = 10.47AIGVNPNCEE207 pKa = 4.06NPQIAMSLAAYY218 pKa = 10.43LSGEE222 pKa = 4.44EE223 pKa = 4.14AQQAHH228 pKa = 5.74YY229 pKa = 10.34DD230 pKa = 3.64EE231 pKa = 6.11RR232 pKa = 11.84NILPSNTNITLADD245 pKa = 4.14DD246 pKa = 5.61PIATATADD254 pKa = 3.87VLDD257 pKa = 4.84HH258 pKa = 6.58CSIMQPIVSAMSNYY272 pKa = 8.63WSPAEE277 pKa = 4.03NMGKK281 pKa = 9.38NLIAGDD287 pKa = 3.9VTHH290 pKa = 7.57DD291 pKa = 3.41NAAEE295 pKa = 4.06KK296 pKa = 10.14TEE298 pKa = 4.06DD299 pKa = 3.71MNTAMNTDD307 pKa = 3.18VAADD311 pKa = 3.56AEE313 pKa = 4.57EE314 pKa = 4.17ATEE317 pKa = 3.94
Molecular weight: 33.72 kDa
Isoelectric point according different methods:
Protein with the highest isoelectric point:
>tr|R7QVM5|R7QVM5_9FIRM 6-O-methylguanine DNA methyltransferase DNA binding domain protein OS=Roseburia sp. CAG:182 OX=1262942 GN=BN520_01757 PE=4 SV=1
MM1 pKa = 7.54RR2 pKa = 11.84RR3 pKa = 11.84TVFMCIEE10 pKa = 4.95LIFFCWFFLPLLLKK24 pKa = 10.98GILNVGNFAGMCLSALALFYY44 pKa = 10.17TGKK47 pKa = 10.2RR48 pKa = 11.84EE49 pKa = 4.11YY50 pKa = 11.14VSGLLSMLRR59 pKa = 11.84EE60 pKa = 3.89NRR62 pKa = 11.84GFCIAEE68 pKa = 3.81WVVRR72 pKa = 11.84IAAVAVCLLLAVSAVRR88 pKa = 11.84IAAAGYY94 pKa = 10.01KK95 pKa = 9.59KK96 pKa = 10.8APDD99 pKa = 3.39TKK101 pKa = 9.56KK102 pKa = 10.34RR103 pKa = 11.84RR104 pKa = 11.84IRR106 pKa = 11.84RR107 pKa = 11.84HH108 pKa = 5.7RR109 pKa = 11.84SSCLAVKK116 pKa = 10.29
MM1 pKa = 7.54RR2 pKa = 11.84RR3 pKa = 11.84TVFMCIEE10 pKa = 4.95LIFFCWFFLPLLLKK24 pKa = 10.98GILNVGNFAGMCLSALALFYY44 pKa = 10.17TGKK47 pKa = 10.2RR48 pKa = 11.84EE49 pKa = 4.11YY50 pKa = 11.14VSGLLSMLRR59 pKa = 11.84EE60 pKa = 3.89NRR62 pKa = 11.84GFCIAEE68 pKa = 3.81WVVRR72 pKa = 11.84IAAVAVCLLLAVSAVRR88 pKa = 11.84IAAAGYY94 pKa = 10.01KK95 pKa = 9.59KK96 pKa = 10.8APDD99 pKa = 3.39TKK101 pKa = 9.56KK102 pKa = 10.34RR103 pKa = 11.84RR104 pKa = 11.84IRR106 pKa = 11.84RR107 pKa = 11.84HH108 pKa = 5.7RR109 pKa = 11.84SSCLAVKK116 pKa = 10.29
Molecular weight: 13.09 kDa
Isoelectric point according different methods:
Peptides (in silico digests for buttom-up proteomics)
Below you can find in silico digests of the whole proteome with Trypsin, Chymotrypsin, Trypsin+LysC, LysN, ArgC proteases suitable for different mass spec machines.| Try ESI |
 |
|---|
| ChTry ESI |
|
|---|
| ArgC ESI |
|
|---|
| LysN ESI |
|
|---|
| TryLysC ESI |
|
|---|
| Try MALDI |
|
|---|
| ChTry MALDI |
|
|---|
| ArgC MALDI |
|
|---|
| LysN MALDI |
|
|---|
| TryLysC MALDI |
|
|---|
| Try LTQ |
|
|---|
| ChTry LTQ |
|
|---|
| ArgC LTQ |
|
|---|
| LysN LTQ |
|
|---|
| TryLysC LTQ |
|
|---|
| Try MSlow |
|
|---|
| ChTry MSlow |
|
|---|
| ArgC MSlow |
|
|---|
| LysN MSlow |
|
|---|
| TryLysC MSlow |
|
|---|
| Try MShigh |
|
|---|
| ChTry MShigh |
|
|---|
| ArgC MShigh |
|
|---|
| LysN MShigh |
|
|---|
| TryLysC MShigh |
|
|---|
General Statistics
Number of major isoforms |
Number of additional isoforms |
Number of all proteins |
Number of amino acids |
Min. Seq. Length |
Max. Seq. Length |
Avg. Seq. Length |
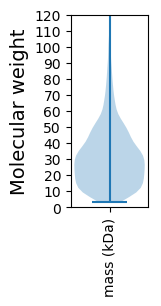
Avg. Mol. Weight |
|---|---|---|---|---|---|---|---|
0 |
732898 |
29 |
2529 |
290.5 |
32.57 |
Amino acid frequency
Ala |
Cys |
Asp |
Glu |
Phe |
Gly |
His |
Ile |
Lys |
Leu |
|---|---|---|---|---|---|---|---|---|---|
7.908 ± 0.051 | 1.488 ± 0.023 |
5.911 ± 0.042 | 7.902 ± 0.06 |
4.126 ± 0.04 | 7.023 ± 0.04 |
1.757 ± 0.022 | 7.162 ± 0.05 |
6.972 ± 0.04 | 8.835 ± 0.049 |
Met |
Asn |
Gln |
Pro |
Arg |
Ser |
Thr |
Val |
Trp |
Tyr |
|---|---|---|---|---|---|---|---|---|---|
3.177 ± 0.025 | 4.196 ± 0.036 |
3.115 ± 0.028 | 3.174 ± 0.03 |
4.33 ± 0.034 | 5.469 ± 0.041 |
5.42 ± 0.04 | 7.035 ± 0.04 |
0.849 ± 0.019 | 4.143 ± 0.035 |
Most of the basic statistics you can see at this page can be downloaded from this CSV file
See this proteome in:

Proteome-pI is available under Creative Commons Attribution-NoDerivs license, for more details see here
| Reference: Kozlowski LP. Proteome-pI 2.0: Proteome Isoelectric Point Database Update. Nucleic Acids Res. 2021, doi: 10.1093/nar/gkab944 | Contact: Lukasz P. Kozlowski |