Sutterella sp. CAG:397
Taxonomy: cellular organisms; Bacteria; Proteobacteria; Betaproteobacteria; Burkholderiales; Sutterellaceae; Sutterella; environmental samples
Average proteome isoelectric point is 6.82
Get precalculated fractions of proteins
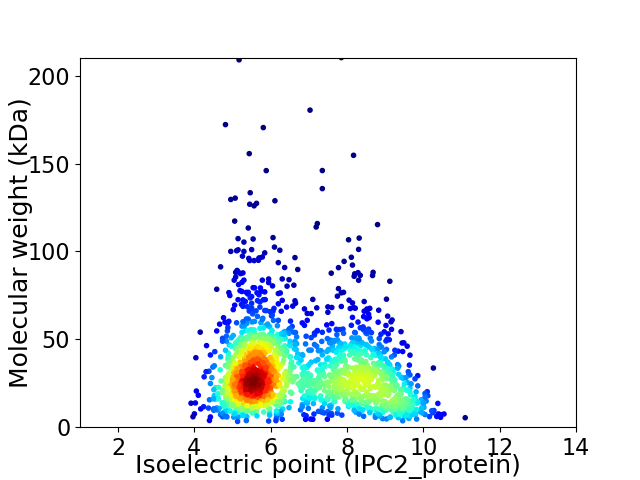
Virtual 2D-PAGE plot for 1804 proteins (isoelectric point calculated using IPC2_protein)
Get csv file with sequences according to given criteria:
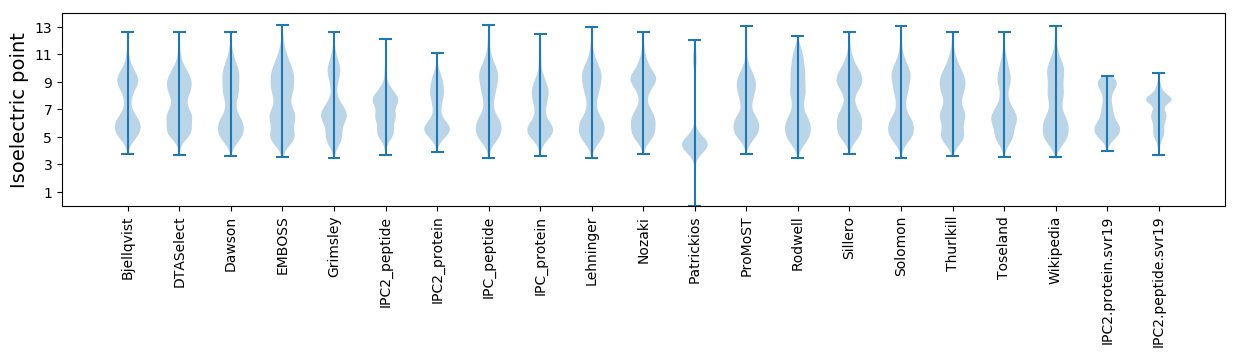
* You can choose from 21 different methods for calculating isoelectric point
Summary statistics related to proteome-wise predictions
Protein with the lowest isoelectric point:
>tr|R7C0J0|R7C0J0_9BURK Ribonuclease HII OS=Sutterella sp. CAG:397 OX=1262976 GN=rnhB PE=3 SV=1
MM1 pKa = 7.73PEE3 pKa = 3.79EE4 pKa = 3.98LVIFVFYY11 pKa = 11.04DD12 pKa = 3.39VVGNGGNAIFVEE24 pKa = 4.76YY25 pKa = 10.53SLSSQFGLYY34 pKa = 10.28LVVIEE39 pKa = 4.58MEE41 pKa = 3.92EE42 pKa = 4.05FGYY45 pKa = 10.16QFQWTHH51 pKa = 4.92
MM1 pKa = 7.73PEE3 pKa = 3.79EE4 pKa = 3.98LVIFVFYY11 pKa = 11.04DD12 pKa = 3.39VVGNGGNAIFVEE24 pKa = 4.76YY25 pKa = 10.53SLSSQFGLYY34 pKa = 10.28LVVIEE39 pKa = 4.58MEE41 pKa = 3.92EE42 pKa = 4.05FGYY45 pKa = 10.16QFQWTHH51 pKa = 4.92
Molecular weight: 5.94 kDa
Isoelectric point according different methods:
Protein with the highest isoelectric point:
>tr|R7C4R1|R7C4R1_9BURK ATP synthase epsilon chain OS=Sutterella sp. CAG:397 OX=1262976 GN=atpC PE=3 SV=1
MM1 pKa = 6.85ATKK4 pKa = 9.51RR5 pKa = 11.84TYY7 pKa = 10.29QPSKK11 pKa = 8.35IKK13 pKa = 10.26RR14 pKa = 11.84VRR16 pKa = 11.84THH18 pKa = 6.04GFLVRR23 pKa = 11.84SRR25 pKa = 11.84TKK27 pKa = 10.45GGRR30 pKa = 11.84HH31 pKa = 3.49VLARR35 pKa = 11.84RR36 pKa = 11.84RR37 pKa = 11.84AKK39 pKa = 10.27GRR41 pKa = 11.84HH42 pKa = 5.09KK43 pKa = 10.72LALL46 pKa = 3.92
MM1 pKa = 6.85ATKK4 pKa = 9.51RR5 pKa = 11.84TYY7 pKa = 10.29QPSKK11 pKa = 8.35IKK13 pKa = 10.26RR14 pKa = 11.84VRR16 pKa = 11.84THH18 pKa = 6.04GFLVRR23 pKa = 11.84SRR25 pKa = 11.84TKK27 pKa = 10.45GGRR30 pKa = 11.84HH31 pKa = 3.49VLARR35 pKa = 11.84RR36 pKa = 11.84RR37 pKa = 11.84AKK39 pKa = 10.27GRR41 pKa = 11.84HH42 pKa = 5.09KK43 pKa = 10.72LALL46 pKa = 3.92
Molecular weight: 5.38 kDa
Isoelectric point according different methods:
Peptides (in silico digests for buttom-up proteomics)
Below you can find in silico digests of the whole proteome with Trypsin, Chymotrypsin, Trypsin+LysC, LysN, ArgC proteases suitable for different mass spec machines.| Try ESI |
 |
|---|
| ChTry ESI |
|
|---|
| ArgC ESI |
|
|---|
| LysN ESI |
|
|---|
| TryLysC ESI |
|
|---|
| Try MALDI |
|
|---|
| ChTry MALDI |
|
|---|
| ArgC MALDI |
|
|---|
| LysN MALDI |
|
|---|
| TryLysC MALDI |
|
|---|
| Try LTQ |
|
|---|
| ChTry LTQ |
|
|---|
| ArgC LTQ |
|
|---|
| LysN LTQ |
|
|---|
| TryLysC LTQ |
|
|---|
| Try MSlow |
|
|---|
| ChTry MSlow |
|
|---|
| ArgC MSlow |
|
|---|
| LysN MSlow |
|
|---|
| TryLysC MSlow |
|
|---|
| Try MShigh |
|
|---|
| ChTry MShigh |
|
|---|
| ArgC MShigh |
|
|---|
| LysN MShigh |
|
|---|
| TryLysC MShigh |
|
|---|
General Statistics
Number of major isoforms |
Number of additional isoforms |
Number of all proteins |
Number of amino acids |
Min. Seq. Length |
Max. Seq. Length |
Avg. Seq. Length |
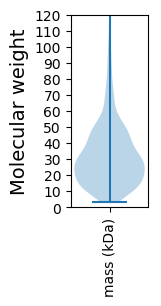
Avg. Mol. Weight |
|---|---|---|---|---|---|---|---|
0 |
560900 |
32 |
1940 |
310.9 |
34.0 |
Amino acid frequency
Ala |
Cys |
Asp |
Glu |
Phe |
Gly |
His |
Ile |
Lys |
Leu |
|---|---|---|---|---|---|---|---|---|---|
11.673 ± 0.076 | 1.314 ± 0.022 |
5.278 ± 0.044 | 6.197 ± 0.061 |
4.076 ± 0.04 | 7.683 ± 0.058 |
1.826 ± 0.026 | 5.205 ± 0.04 |
5.299 ± 0.052 | 9.608 ± 0.062 |
Met |
Asn |
Gln |
Pro |
Arg |
Ser |
Thr |
Val |
Trp |
Tyr |
|---|---|---|---|---|---|---|---|---|---|
2.666 ± 0.029 | 3.051 ± 0.028 |
4.465 ± 0.034 | 2.829 ± 0.031 |
6.039 ± 0.05 | 5.259 ± 0.04 |
5.905 ± 0.039 | 7.908 ± 0.054 |
1.262 ± 0.024 | 2.454 ± 0.035 |
Most of the basic statistics you can see at this page can be downloaded from this CSV file
See this proteome in:

Proteome-pI is available under Creative Commons Attribution-NoDerivs license, for more details see here
| Reference: Kozlowski LP. Proteome-pI 2.0: Proteome Isoelectric Point Database Update. Nucleic Acids Res. 2021, doi: 10.1093/nar/gkab944 | Contact: Lukasz P. Kozlowski |