Dorea formicigenerans CAG:28
Taxonomy: cellular organisms; Bacteria; Terrabacteria group; Firmicutes; Clostridia; Eubacteriales; Lachnospiraceae; Dorea; environmental samples
Average proteome isoelectric point is 5.98
Get precalculated fractions of proteins
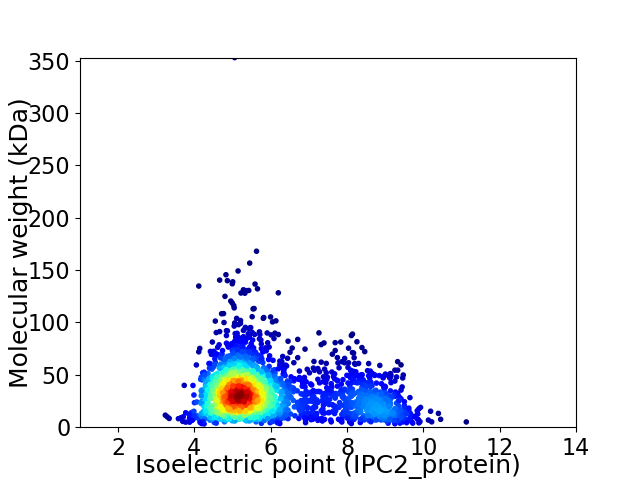
Virtual 2D-PAGE plot for 2461 proteins (isoelectric point calculated using IPC2_protein)
Get csv file with sequences according to given criteria:
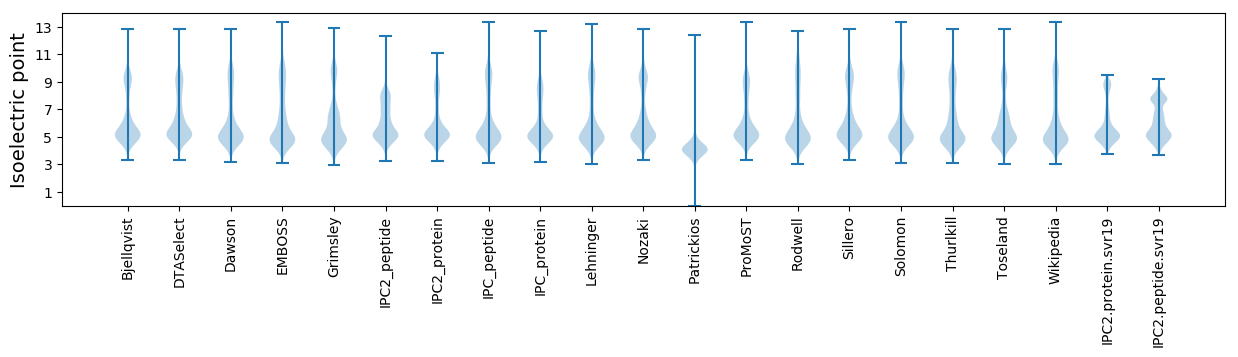
* You can choose from 21 different methods for calculating isoelectric point
Summary statistics related to proteome-wise predictions
Protein with the lowest isoelectric point:
>tr|R6SVG2|R6SVG2_9FIRM Ferritin-like diiron domain-containing protein OS=Dorea formicigenerans CAG:28 OX=1263073 GN=BN586_00653 PE=4 SV=1
MM1 pKa = 7.36KK2 pKa = 10.6AEE4 pKa = 4.05FDD6 pKa = 3.49EE7 pKa = 4.71AVYY10 pKa = 10.65DD11 pKa = 4.05EE12 pKa = 4.54QVSMMEE18 pKa = 4.1MVLDD22 pKa = 3.51VDD24 pKa = 5.57DD25 pKa = 4.95IVSEE29 pKa = 4.06MSAIRR34 pKa = 11.84DD35 pKa = 3.89EE36 pKa = 4.39YY37 pKa = 11.14CKK39 pKa = 10.91YY40 pKa = 10.86LL41 pKa = 3.8
MM1 pKa = 7.36KK2 pKa = 10.6AEE4 pKa = 4.05FDD6 pKa = 3.49EE7 pKa = 4.71AVYY10 pKa = 10.65DD11 pKa = 4.05EE12 pKa = 4.54QVSMMEE18 pKa = 4.1MVLDD22 pKa = 3.51VDD24 pKa = 5.57DD25 pKa = 4.95IVSEE29 pKa = 4.06MSAIRR34 pKa = 11.84DD35 pKa = 3.89EE36 pKa = 4.39YY37 pKa = 11.14CKK39 pKa = 10.91YY40 pKa = 10.86LL41 pKa = 3.8
Molecular weight: 4.84 kDa
Isoelectric point according different methods:
Protein with the highest isoelectric point:
>tr|R6SNG9|R6SNG9_9FIRM tRNA modification GTPase MnmE OS=Dorea formicigenerans CAG:28 OX=1263073 GN=mnmE PE=3 SV=1
MM1 pKa = 7.67KK2 pKa = 8.72MTFQPKK8 pKa = 8.95KK9 pKa = 7.58RR10 pKa = 11.84QRR12 pKa = 11.84SKK14 pKa = 9.0VHH16 pKa = 5.93GFRR19 pKa = 11.84SRR21 pKa = 11.84MSTAGGRR28 pKa = 11.84KK29 pKa = 8.71VLAARR34 pKa = 11.84RR35 pKa = 11.84AKK37 pKa = 10.1GRR39 pKa = 11.84KK40 pKa = 8.83KK41 pKa = 10.63LSAA44 pKa = 3.95
MM1 pKa = 7.67KK2 pKa = 8.72MTFQPKK8 pKa = 8.95KK9 pKa = 7.58RR10 pKa = 11.84QRR12 pKa = 11.84SKK14 pKa = 9.0VHH16 pKa = 5.93GFRR19 pKa = 11.84SRR21 pKa = 11.84MSTAGGRR28 pKa = 11.84KK29 pKa = 8.71VLAARR34 pKa = 11.84RR35 pKa = 11.84AKK37 pKa = 10.1GRR39 pKa = 11.84KK40 pKa = 8.83KK41 pKa = 10.63LSAA44 pKa = 3.95
Molecular weight: 5.03 kDa
Isoelectric point according different methods:
Peptides (in silico digests for buttom-up proteomics)
Below you can find in silico digests of the whole proteome with Trypsin, Chymotrypsin, Trypsin+LysC, LysN, ArgC proteases suitable for different mass spec machines.| Try ESI |
 |
|---|
| ChTry ESI |
|
|---|
| ArgC ESI |
|
|---|
| LysN ESI |
|
|---|
| TryLysC ESI |
|
|---|
| Try MALDI |
|
|---|
| ChTry MALDI |
|
|---|
| ArgC MALDI |
|
|---|
| LysN MALDI |
|
|---|
| TryLysC MALDI |
|
|---|
| Try LTQ |
|
|---|
| ChTry LTQ |
|
|---|
| ArgC LTQ |
|
|---|
| LysN LTQ |
|
|---|
| TryLysC LTQ |
|
|---|
| Try MSlow |
|
|---|
| ChTry MSlow |
|
|---|
| ArgC MSlow |
|
|---|
| LysN MSlow |
|
|---|
| TryLysC MSlow |
|
|---|
| Try MShigh |
|
|---|
| ChTry MShigh |
|
|---|
| ArgC MShigh |
|
|---|
| LysN MShigh |
|
|---|
| TryLysC MShigh |
|
|---|
General Statistics
Number of major isoforms |
Number of additional isoforms |
Number of all proteins |
Number of amino acids |
Min. Seq. Length |
Max. Seq. Length |
Avg. Seq. Length |
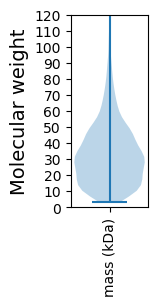
Avg. Mol. Weight |
|---|---|---|---|---|---|---|---|
0 |
755461 |
29 |
3288 |
307.0 |
34.39 |
Amino acid frequency
Ala |
Cys |
Asp |
Glu |
Phe |
Gly |
His |
Ile |
Lys |
Leu |
|---|---|---|---|---|---|---|---|---|---|
7.426 ± 0.056 | 1.506 ± 0.017 |
5.683 ± 0.048 | 7.898 ± 0.063 |
3.832 ± 0.036 | 7.222 ± 0.045 |
1.781 ± 0.023 | 7.621 ± 0.045 |
7.279 ± 0.045 | 8.737 ± 0.051 |
Met |
Asn |
Gln |
Pro |
Arg |
Ser |
Thr |
Val |
Trp |
Tyr |
|---|---|---|---|---|---|---|---|---|---|
3.276 ± 0.025 | 4.276 ± 0.03 |
3.241 ± 0.029 | 3.282 ± 0.032 |
4.12 ± 0.037 | 5.445 ± 0.038 |
5.323 ± 0.034 | 7.149 ± 0.043 |
0.843 ± 0.016 | 4.057 ± 0.034 |
Most of the basic statistics you can see at this page can be downloaded from this CSV file
See this proteome in:

Proteome-pI is available under Creative Commons Attribution-NoDerivs license, for more details see here
| Reference: Kozlowski LP. Proteome-pI 2.0: Proteome Isoelectric Point Database Update. Nucleic Acids Res. 2021, doi: 10.1093/nar/gkab944 | Contact: Lukasz P. Kozlowski |