Microbacterium phage Pioneer3
Taxonomy: Viruses; Duplodnaviria; Heunggongvirae; Uroviricota; Caudoviricetes; Caudovirales; Siphoviridae; unclassified Siphoviridae
Average proteome isoelectric point is 6.03
Get precalculated fractions of proteins
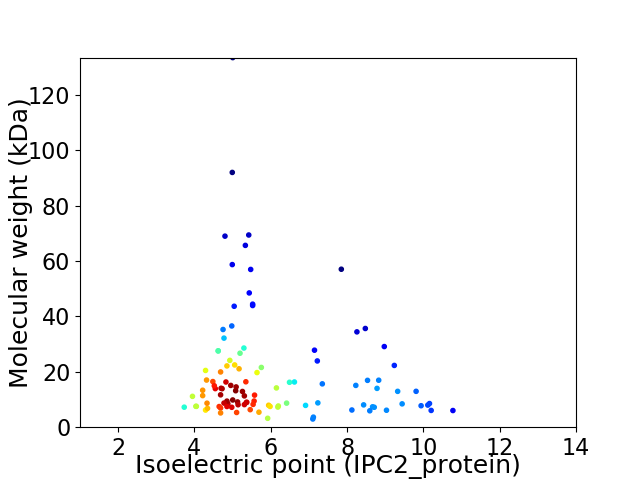
Virtual 2D-PAGE plot for 108 proteins (isoelectric point calculated using IPC2_protein)
Get csv file with sequences according to given criteria:
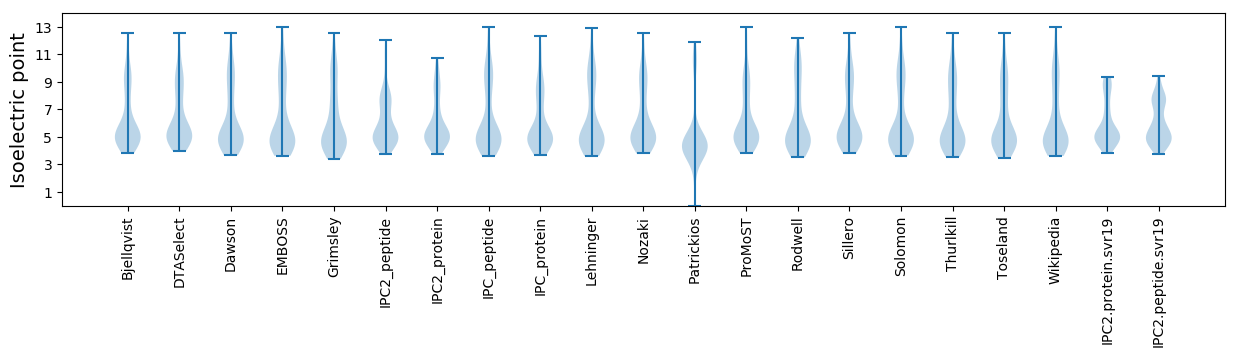
* You can choose from 21 different methods for calculating isoelectric point
Summary statistics related to proteome-wise predictions
Protein with the lowest isoelectric point:
>tr|A0A2Z4Q7E6|A0A2Z4Q7E6_9CAUD Uncharacterized protein OS=Microbacterium phage Pioneer3 OX=2201440 GN=67 PE=4 SV=1
MM1 pKa = 7.51SICEE5 pKa = 4.15NFEE8 pKa = 3.96KK9 pKa = 10.4TIGTMTLEE17 pKa = 3.75ASIYY21 pKa = 8.69EE22 pKa = 4.21DD23 pKa = 4.33GYY25 pKa = 11.55VLVALVDD32 pKa = 3.54QLGFEE37 pKa = 4.42IASLDD42 pKa = 3.51GTAQDD47 pKa = 3.94GNTAEE52 pKa = 4.37LRR54 pKa = 11.84THH56 pKa = 6.7IEE58 pKa = 3.77STLIEE63 pKa = 3.96QHH65 pKa = 5.95YY66 pKa = 11.05NEE68 pKa = 4.51
MM1 pKa = 7.51SICEE5 pKa = 4.15NFEE8 pKa = 3.96KK9 pKa = 10.4TIGTMTLEE17 pKa = 3.75ASIYY21 pKa = 8.69EE22 pKa = 4.21DD23 pKa = 4.33GYY25 pKa = 11.55VLVALVDD32 pKa = 3.54QLGFEE37 pKa = 4.42IASLDD42 pKa = 3.51GTAQDD47 pKa = 3.94GNTAEE52 pKa = 4.37LRR54 pKa = 11.84THH56 pKa = 6.7IEE58 pKa = 3.77STLIEE63 pKa = 3.96QHH65 pKa = 5.95YY66 pKa = 11.05NEE68 pKa = 4.51
Molecular weight: 7.54 kDa
Isoelectric point according different methods:
Protein with the highest isoelectric point:
>tr|A0A2Z4Q7P9|A0A2Z4Q7P9_9CAUD Uncharacterized protein OS=Microbacterium phage Pioneer3 OX=2201440 GN=92 PE=4 SV=1
MM1 pKa = 7.53RR2 pKa = 11.84PEE4 pKa = 3.45KK5 pKa = 10.29RR6 pKa = 11.84RR7 pKa = 11.84AGRR10 pKa = 11.84RR11 pKa = 11.84IRR13 pKa = 11.84KK14 pKa = 7.44QRR16 pKa = 11.84KK17 pKa = 6.11QIRR20 pKa = 11.84RR21 pKa = 11.84LGMAMGVAGKK31 pKa = 8.64SLRR34 pKa = 11.84QFGRR38 pKa = 11.84TVARR42 pKa = 11.84AGRR45 pKa = 11.84ALSGIVEE52 pKa = 4.27PP53 pKa = 5.45
MM1 pKa = 7.53RR2 pKa = 11.84PEE4 pKa = 3.45KK5 pKa = 10.29RR6 pKa = 11.84RR7 pKa = 11.84AGRR10 pKa = 11.84RR11 pKa = 11.84IRR13 pKa = 11.84KK14 pKa = 7.44QRR16 pKa = 11.84KK17 pKa = 6.11QIRR20 pKa = 11.84RR21 pKa = 11.84LGMAMGVAGKK31 pKa = 8.64SLRR34 pKa = 11.84QFGRR38 pKa = 11.84TVARR42 pKa = 11.84AGRR45 pKa = 11.84ALSGIVEE52 pKa = 4.27PP53 pKa = 5.45
Molecular weight: 6.02 kDa
Isoelectric point according different methods:
Peptides (in silico digests for buttom-up proteomics)
Below you can find in silico digests of the whole proteome with Trypsin, Chymotrypsin, Trypsin+LysC, LysN, ArgC proteases suitable for different mass spec machines.| Try ESI |
 |
|---|
| ChTry ESI |
|
|---|
| ArgC ESI |
|
|---|
| LysN ESI |
|
|---|
| TryLysC ESI |
|
|---|
| Try MALDI |
|
|---|
| ChTry MALDI |
|
|---|
| ArgC MALDI |
|
|---|
| LysN MALDI |
|
|---|
| TryLysC MALDI |
|
|---|
| Try LTQ |
|
|---|
| ChTry LTQ |
|
|---|
| ArgC LTQ |
|
|---|
| LysN LTQ |
|
|---|
| TryLysC LTQ |
|
|---|
| Try MSlow |
|
|---|
| ChTry MSlow |
|
|---|
| ArgC MSlow |
|
|---|
| LysN MSlow |
|
|---|
| TryLysC MSlow |
|
|---|
| Try MShigh |
|
|---|
| ChTry MShigh |
|
|---|
| ArgC MShigh |
|
|---|
| LysN MShigh |
|
|---|
| TryLysC MShigh |
|
|---|
General Statistics
Number of major isoforms |
Number of additional isoforms |
Number of all proteins |
Number of amino acids |
Min. Seq. Length |
Max. Seq. Length |
Avg. Seq. Length |
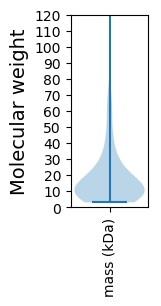
Avg. Mol. Weight |
|---|---|---|---|---|---|---|---|
0 |
18892 |
27 |
1260 |
174.9 |
19.31 |
Amino acid frequency
Ala |
Cys |
Asp |
Glu |
Phe |
Gly |
His |
Ile |
Lys |
Leu |
|---|---|---|---|---|---|---|---|---|---|
10.269 ± 0.285 | 0.418 ± 0.068 |
6.336 ± 0.261 | 7.373 ± 0.369 |
3.329 ± 0.123 | 8.57 ± 0.414 |
1.752 ± 0.142 | 5.145 ± 0.175 |
4.319 ± 0.366 | 6.992 ± 0.213 |
Met |
Asn |
Gln |
Pro |
Arg |
Ser |
Thr |
Val |
Trp |
Tyr |
|---|---|---|---|---|---|---|---|---|---|
2.371 ± 0.166 | 3.79 ± 0.239 |
4.483 ± 0.2 | 3.372 ± 0.187 |
7.003 ± 0.253 | 5.817 ± 0.285 |
6.235 ± 0.29 | 7.553 ± 0.206 |
1.906 ± 0.134 | 2.964 ± 0.119 |
Most of the basic statistics you can see at this page can be downloaded from this CSV file
See this proteome in:

Proteome-pI is available under Creative Commons Attribution-NoDerivs license, for more details see here
| Reference: Kozlowski LP. Proteome-pI 2.0: Proteome Isoelectric Point Database Update. Nucleic Acids Res. 2021, doi: 10.1093/nar/gkab944 | Contact: Lukasz P. Kozlowski |