Lachnospiraceae bacterium 28-4
Taxonomy: cellular organisms; Bacteria; Terrabacteria group; Firmicutes; Clostridia; Eubacteriales; Lachnospiraceae; unclassified Lachnospiraceae
Average proteome isoelectric point is 6.22
Get precalculated fractions of proteins
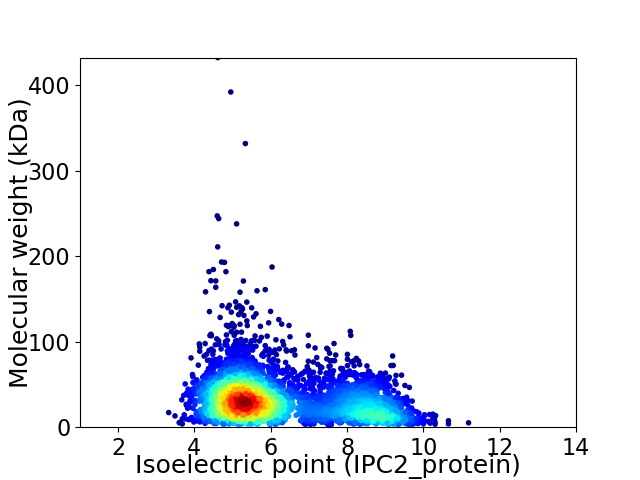
Virtual 2D-PAGE plot for 3953 proteins (isoelectric point calculated using IPC2_protein)
Get csv file with sequences according to given criteria:
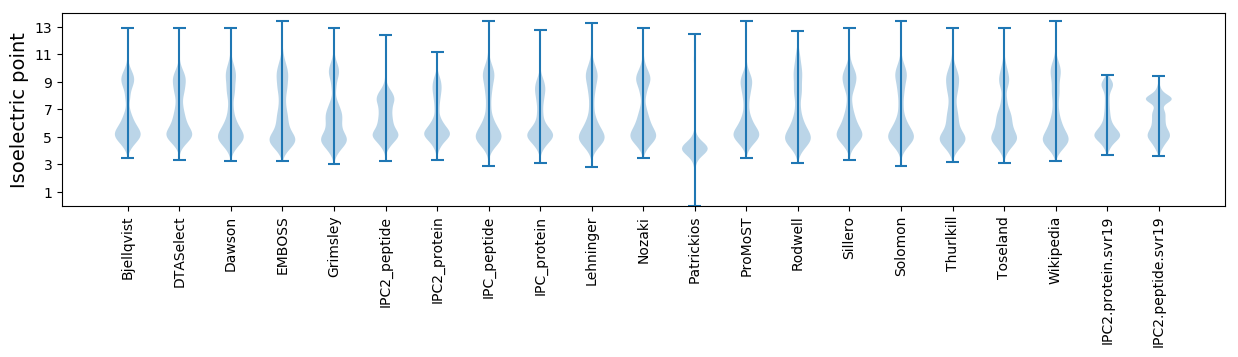
* You can choose from 21 different methods for calculating isoelectric point
Summary statistics related to proteome-wise predictions
Protein with the lowest isoelectric point:
>tr|R9JDI8|R9JDI8_9FIRM RluA family pseudouridine synthase OS=Lachnospiraceae bacterium 28-4 OX=397287 GN=C807_00988 PE=3 SV=1
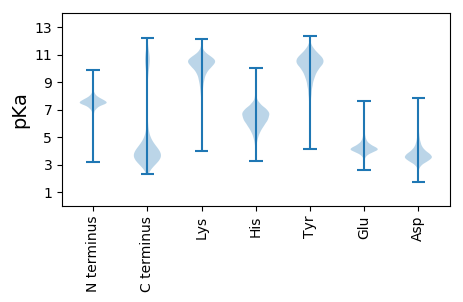
MM1 pKa = 7.53KK2 pKa = 10.15KK3 pKa = 10.53NSIRR7 pKa = 11.84YY8 pKa = 5.88TLPALVLCIGAFFTPVTAYY27 pKa = 10.57AKK29 pKa = 10.56GGGDD33 pKa = 3.4TTPPSISAEE42 pKa = 3.94LSGDD46 pKa = 3.75TLHH49 pKa = 7.94IEE51 pKa = 5.14ADD53 pKa = 3.99DD54 pKa = 4.07EE55 pKa = 4.93DD56 pKa = 4.91SGVDD60 pKa = 3.24AVYY63 pKa = 10.55IGTKK67 pKa = 9.6RR68 pKa = 11.84INYY71 pKa = 9.34RR72 pKa = 11.84VDD74 pKa = 2.87HH75 pKa = 6.87AIDD78 pKa = 3.79VEE80 pKa = 4.29FEE82 pKa = 4.54DD83 pKa = 4.36YY84 pKa = 11.25AGTEE88 pKa = 4.21TEE90 pKa = 4.45TVGVYY95 pKa = 10.67AIDD98 pKa = 3.57FAGNQSEE105 pKa = 4.51VVEE108 pKa = 4.57VKK110 pKa = 10.44NPYY113 pKa = 10.0YY114 pKa = 10.54EE115 pKa = 4.36GTADD119 pKa = 3.66TEE121 pKa = 4.69AEE123 pKa = 4.13NSAEE127 pKa = 4.18PNPFTPAGQASVLDD141 pKa = 3.89NATDD145 pKa = 3.92GDD147 pKa = 3.9GKK149 pKa = 10.82EE150 pKa = 4.47FYY152 pKa = 10.63TFITPEE158 pKa = 3.87EE159 pKa = 4.02NVFYY163 pKa = 10.83LVIDD167 pKa = 3.74NQRR170 pKa = 11.84DD171 pKa = 3.67SEE173 pKa = 4.36NVYY176 pKa = 10.43FLNAVTEE183 pKa = 4.46DD184 pKa = 3.89DD185 pKa = 4.12LAALAEE191 pKa = 4.38KK192 pKa = 10.72GEE194 pKa = 4.11KK195 pKa = 10.45DD196 pKa = 3.39GTGEE200 pKa = 4.05SAVPEE205 pKa = 4.5VIVCTCTDD213 pKa = 2.86KK214 pKa = 11.71CEE216 pKa = 4.25AGMVNTSCPVCKK228 pKa = 10.05NDD230 pKa = 5.46LSACTGKK237 pKa = 9.86EE238 pKa = 3.6QAPPEE243 pKa = 4.22TEE245 pKa = 4.0EE246 pKa = 4.18PAKK249 pKa = 10.71EE250 pKa = 3.9DD251 pKa = 3.49TKK253 pKa = 10.99KK254 pKa = 10.99GSGGAFIFVLLAALAVGGAGYY275 pKa = 9.88YY276 pKa = 9.92FKK278 pKa = 10.35IYY280 pKa = 9.82KK281 pKa = 9.29PKK283 pKa = 10.33HH284 pKa = 6.21DD285 pKa = 5.17LDD287 pKa = 4.19DD288 pKa = 6.18AEE290 pKa = 5.8DD291 pKa = 4.17LDD293 pKa = 4.97EE294 pKa = 4.97LLEE297 pKa = 5.64DD298 pKa = 3.89EE299 pKa = 6.16DD300 pKa = 3.93EE301 pKa = 5.56AEE303 pKa = 4.32VNEE306 pKa = 5.01DD307 pKa = 4.43SDD309 pKa = 4.37GQDD312 pKa = 3.04MAVEE316 pKa = 4.6AGMDD320 pKa = 3.59MDD322 pKa = 4.27AAAYY326 pKa = 10.13DD327 pKa = 4.95DD328 pKa = 4.52YY329 pKa = 11.75PEE331 pKa = 6.45DD332 pKa = 5.39DD333 pKa = 5.22DD334 pKa = 5.99PDD336 pKa = 4.39GEE338 pKa = 4.31PEE340 pKa = 3.93QEE342 pKa = 4.22GMEE345 pKa = 4.27EE346 pKa = 3.88
MM1 pKa = 7.53KK2 pKa = 10.15KK3 pKa = 10.53NSIRR7 pKa = 11.84YY8 pKa = 5.88TLPALVLCIGAFFTPVTAYY27 pKa = 10.57AKK29 pKa = 10.56GGGDD33 pKa = 3.4TTPPSISAEE42 pKa = 3.94LSGDD46 pKa = 3.75TLHH49 pKa = 7.94IEE51 pKa = 5.14ADD53 pKa = 3.99DD54 pKa = 4.07EE55 pKa = 4.93DD56 pKa = 4.91SGVDD60 pKa = 3.24AVYY63 pKa = 10.55IGTKK67 pKa = 9.6RR68 pKa = 11.84INYY71 pKa = 9.34RR72 pKa = 11.84VDD74 pKa = 2.87HH75 pKa = 6.87AIDD78 pKa = 3.79VEE80 pKa = 4.29FEE82 pKa = 4.54DD83 pKa = 4.36YY84 pKa = 11.25AGTEE88 pKa = 4.21TEE90 pKa = 4.45TVGVYY95 pKa = 10.67AIDD98 pKa = 3.57FAGNQSEE105 pKa = 4.51VVEE108 pKa = 4.57VKK110 pKa = 10.44NPYY113 pKa = 10.0YY114 pKa = 10.54EE115 pKa = 4.36GTADD119 pKa = 3.66TEE121 pKa = 4.69AEE123 pKa = 4.13NSAEE127 pKa = 4.18PNPFTPAGQASVLDD141 pKa = 3.89NATDD145 pKa = 3.92GDD147 pKa = 3.9GKK149 pKa = 10.82EE150 pKa = 4.47FYY152 pKa = 10.63TFITPEE158 pKa = 3.87EE159 pKa = 4.02NVFYY163 pKa = 10.83LVIDD167 pKa = 3.74NQRR170 pKa = 11.84DD171 pKa = 3.67SEE173 pKa = 4.36NVYY176 pKa = 10.43FLNAVTEE183 pKa = 4.46DD184 pKa = 3.89DD185 pKa = 4.12LAALAEE191 pKa = 4.38KK192 pKa = 10.72GEE194 pKa = 4.11KK195 pKa = 10.45DD196 pKa = 3.39GTGEE200 pKa = 4.05SAVPEE205 pKa = 4.5VIVCTCTDD213 pKa = 2.86KK214 pKa = 11.71CEE216 pKa = 4.25AGMVNTSCPVCKK228 pKa = 10.05NDD230 pKa = 5.46LSACTGKK237 pKa = 9.86EE238 pKa = 3.6QAPPEE243 pKa = 4.22TEE245 pKa = 4.0EE246 pKa = 4.18PAKK249 pKa = 10.71EE250 pKa = 3.9DD251 pKa = 3.49TKK253 pKa = 10.99KK254 pKa = 10.99GSGGAFIFVLLAALAVGGAGYY275 pKa = 9.88YY276 pKa = 9.92FKK278 pKa = 10.35IYY280 pKa = 9.82KK281 pKa = 9.29PKK283 pKa = 10.33HH284 pKa = 6.21DD285 pKa = 5.17LDD287 pKa = 4.19DD288 pKa = 6.18AEE290 pKa = 5.8DD291 pKa = 4.17LDD293 pKa = 4.97EE294 pKa = 4.97LLEE297 pKa = 5.64DD298 pKa = 3.89EE299 pKa = 6.16DD300 pKa = 3.93EE301 pKa = 5.56AEE303 pKa = 4.32VNEE306 pKa = 5.01DD307 pKa = 4.43SDD309 pKa = 4.37GQDD312 pKa = 3.04MAVEE316 pKa = 4.6AGMDD320 pKa = 3.59MDD322 pKa = 4.27AAAYY326 pKa = 10.13DD327 pKa = 4.95DD328 pKa = 4.52YY329 pKa = 11.75PEE331 pKa = 6.45DD332 pKa = 5.39DD333 pKa = 5.22DD334 pKa = 5.99PDD336 pKa = 4.39GEE338 pKa = 4.31PEE340 pKa = 3.93QEE342 pKa = 4.22GMEE345 pKa = 4.27EE346 pKa = 3.88
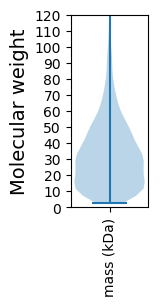
Molecular weight: 37.25 kDa
Isoelectric point according different methods:
Protein with the highest isoelectric point:
>tr|R9J5D8|R9J5D8_9FIRM Uncharacterized protein OS=Lachnospiraceae bacterium 28-4 OX=397287 GN=C807_02816 PE=4 SV=1
MM1 pKa = 7.73KK2 pKa = 8.67MTFQPNKK9 pKa = 8.77RR10 pKa = 11.84KK11 pKa = 9.67RR12 pKa = 11.84KK13 pKa = 8.18KK14 pKa = 8.92VHH16 pKa = 5.48GFRR19 pKa = 11.84ARR21 pKa = 11.84MSTKK25 pKa = 10.15GGRR28 pKa = 11.84KK29 pKa = 8.78VLAARR34 pKa = 11.84RR35 pKa = 11.84AKK37 pKa = 9.92GRR39 pKa = 11.84KK40 pKa = 8.91RR41 pKa = 11.84LSAA44 pKa = 3.96
MM1 pKa = 7.73KK2 pKa = 8.67MTFQPNKK9 pKa = 8.77RR10 pKa = 11.84KK11 pKa = 9.67RR12 pKa = 11.84KK13 pKa = 8.18KK14 pKa = 8.92VHH16 pKa = 5.48GFRR19 pKa = 11.84ARR21 pKa = 11.84MSTKK25 pKa = 10.15GGRR28 pKa = 11.84KK29 pKa = 8.78VLAARR34 pKa = 11.84RR35 pKa = 11.84AKK37 pKa = 9.92GRR39 pKa = 11.84KK40 pKa = 8.91RR41 pKa = 11.84LSAA44 pKa = 3.96
Molecular weight: 5.13 kDa
Isoelectric point according different methods:
Peptides (in silico digests for buttom-up proteomics)
Below you can find in silico digests of the whole proteome with Trypsin, Chymotrypsin, Trypsin+LysC, LysN, ArgC proteases suitable for different mass spec machines.| Try ESI |
 |
|---|
| ChTry ESI |
|
|---|
| ArgC ESI |
|
|---|
| LysN ESI |
|
|---|
| TryLysC ESI |
|
|---|
| Try MALDI |
|
|---|
| ChTry MALDI |
|
|---|
| ArgC MALDI |
|
|---|
| LysN MALDI |
|
|---|
| TryLysC MALDI |
|
|---|
| Try LTQ |
|
|---|
| ChTry LTQ |
|
|---|
| ArgC LTQ |
|
|---|
| LysN LTQ |
|
|---|
| TryLysC LTQ |
|
|---|
| Try MSlow |
|
|---|
| ChTry MSlow |
|
|---|
| ArgC MSlow |
|
|---|
| LysN MSlow |
|
|---|
| TryLysC MSlow |
|
|---|
| Try MShigh |
|
|---|
| ChTry MShigh |
|
|---|
| ArgC MShigh |
|
|---|
| LysN MShigh |
|
|---|
| TryLysC MShigh |
|
|---|
General Statistics
Number of major isoforms |
Number of additional isoforms |
Number of all proteins |
Number of amino acids |
Min. Seq. Length |
Max. Seq. Length |
Avg. Seq. Length |
Avg. Mol. Weight |
|---|---|---|---|---|---|---|---|
0 |
1220500 |
24 |
4035 |
308.8 |
34.78 |
Amino acid frequency
Ala |
Cys |
Asp |
Glu |
Phe |
Gly |
His |
Ile |
Lys |
Leu |
|---|---|---|---|---|---|---|---|---|---|
7.547 ± 0.044 | 1.489 ± 0.016 |
5.466 ± 0.031 | 8.303 ± 0.052 |
4.128 ± 0.03 | 7.322 ± 0.038 |
1.695 ± 0.016 | 7.317 ± 0.038 |
6.973 ± 0.034 | 8.762 ± 0.038 |
Met |
Asn |
Gln |
Pro |
Arg |
Ser |
Thr |
Val |
Trp |
Tyr |
|---|---|---|---|---|---|---|---|---|---|
3.255 ± 0.022 | 4.315 ± 0.033 |
3.132 ± 0.025 | 3.104 ± 0.022 |
4.858 ± 0.031 | 5.648 ± 0.035 |
4.866 ± 0.03 | 6.529 ± 0.036 |
0.987 ± 0.015 | 4.303 ± 0.029 |
Most of the basic statistics you can see at this page can be downloaded from this CSV file
See this proteome in:

Proteome-pI is available under Creative Commons Attribution-NoDerivs license, for more details see here
| Reference: Kozlowski LP. Proteome-pI 2.0: Proteome Isoelectric Point Database Update. Nucleic Acids Res. 2021, doi: 10.1093/nar/gkab944 | Contact: Lukasz P. Kozlowski |