Holospora obtusa F1
Taxonomy: cellular organisms; Bacteria; Proteobacteria; Alphaproteobacteria; Holosporales; Holosporaceae; Holospora; Holospora obtusa
Average proteome isoelectric point is 7.4
Get precalculated fractions of proteins
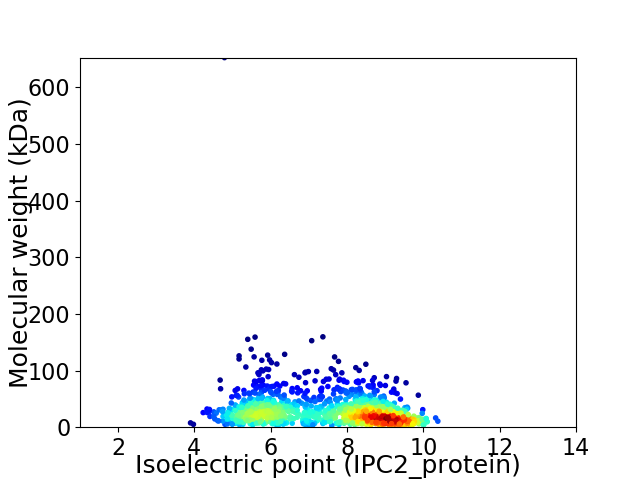
Virtual 2D-PAGE plot for 1116 proteins (isoelectric point calculated using IPC2_protein)
Get csv file with sequences according to given criteria:
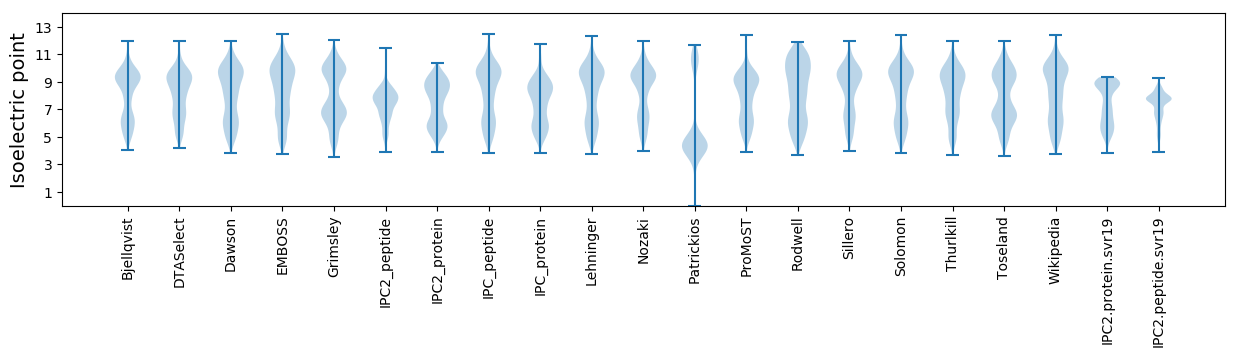
* You can choose from 21 different methods for calculating isoelectric point
Summary statistics related to proteome-wise predictions
Protein with the lowest isoelectric point:
>tr|W6TD85|W6TD85_HOLOB Uncharacterized protein OS=Holospora obtusa F1 OX=1399147 GN=P618_200890 PE=4 SV=1
MM1 pKa = 7.43TNIIDD6 pKa = 3.83LDD8 pKa = 4.08FYY10 pKa = 11.5RR11 pKa = 11.84NFNIVLTIDD20 pKa = 3.73EE21 pKa = 4.66SDD23 pKa = 3.68LMSFCYY29 pKa = 10.36YY30 pKa = 10.31LQPSKK35 pKa = 11.19GGGDD39 pKa = 3.59HH40 pKa = 7.04SPASDD45 pKa = 2.89
MM1 pKa = 7.43TNIIDD6 pKa = 3.83LDD8 pKa = 4.08FYY10 pKa = 11.5RR11 pKa = 11.84NFNIVLTIDD20 pKa = 3.73EE21 pKa = 4.66SDD23 pKa = 3.68LMSFCYY29 pKa = 10.36YY30 pKa = 10.31LQPSKK35 pKa = 11.19GGGDD39 pKa = 3.59HH40 pKa = 7.04SPASDD45 pKa = 2.89
Molecular weight: 5.1 kDa
Isoelectric point according different methods:
Protein with the highest isoelectric point:
>tr|W6THS3|W6THS3_HOLOB DNA repair protein RecO OS=Holospora obtusa F1 OX=1399147 GN=P618_200294 PE=4 SV=1
MM1 pKa = 8.37IMDD4 pKa = 4.38NASFHH9 pKa = 5.58QSQRR13 pKa = 11.84TRR15 pKa = 11.84EE16 pKa = 4.01LLKK19 pKa = 10.72SSRR22 pKa = 11.84CRR24 pKa = 11.84IFFYY28 pKa = 10.54RR29 pKa = 11.84HH30 pKa = 3.61THH32 pKa = 6.16RR33 pKa = 11.84IFWANMKK40 pKa = 10.0RR41 pKa = 11.84WIRR44 pKa = 11.84KK45 pKa = 9.43KK46 pKa = 10.05IEE48 pKa = 4.22CFQGLYY54 pKa = 10.47QSISVFLLYY63 pKa = 10.84HH64 pKa = 5.56NTTAFTVAA72 pKa = 4.12
MM1 pKa = 8.37IMDD4 pKa = 4.38NASFHH9 pKa = 5.58QSQRR13 pKa = 11.84TRR15 pKa = 11.84EE16 pKa = 4.01LLKK19 pKa = 10.72SSRR22 pKa = 11.84CRR24 pKa = 11.84IFFYY28 pKa = 10.54RR29 pKa = 11.84HH30 pKa = 3.61THH32 pKa = 6.16RR33 pKa = 11.84IFWANMKK40 pKa = 10.0RR41 pKa = 11.84WIRR44 pKa = 11.84KK45 pKa = 9.43KK46 pKa = 10.05IEE48 pKa = 4.22CFQGLYY54 pKa = 10.47QSISVFLLYY63 pKa = 10.84HH64 pKa = 5.56NTTAFTVAA72 pKa = 4.12
Molecular weight: 8.86 kDa
Isoelectric point according different methods:
Peptides (in silico digests for buttom-up proteomics)
Below you can find in silico digests of the whole proteome with Trypsin, Chymotrypsin, Trypsin+LysC, LysN, ArgC proteases suitable for different mass spec machines.| Try ESI |
 |
|---|
| ChTry ESI |
|
|---|
| ArgC ESI |
|
|---|
| LysN ESI |
|
|---|
| TryLysC ESI |
|
|---|
| Try MALDI |
|
|---|
| ChTry MALDI |
|
|---|
| ArgC MALDI |
|
|---|
| LysN MALDI |
|
|---|
| TryLysC MALDI |
|
|---|
| Try LTQ |
|
|---|
| ChTry LTQ |
|
|---|
| ArgC LTQ |
|
|---|
| LysN LTQ |
|
|---|
| TryLysC LTQ |
|
|---|
| Try MSlow |
|
|---|
| ChTry MSlow |
|
|---|
| ArgC MSlow |
|
|---|
| LysN MSlow |
|
|---|
| TryLysC MSlow |
|
|---|
| Try MShigh |
|
|---|
| ChTry MShigh |
|
|---|
| ArgC MShigh |
|
|---|
| LysN MShigh |
|
|---|
| TryLysC MShigh |
|
|---|
General Statistics
Number of major isoforms |
Number of additional isoforms |
Number of all proteins |
Number of amino acids |
Min. Seq. Length |
Max. Seq. Length |
Avg. Seq. Length |
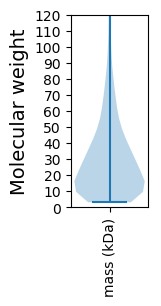
Avg. Mol. Weight |
|---|---|---|---|---|---|---|---|
0 |
308297 |
29 |
5828 |
276.3 |
31.38 |
Amino acid frequency
Ala |
Cys |
Asp |
Glu |
Phe |
Gly |
His |
Ile |
Lys |
Leu |
|---|---|---|---|---|---|---|---|---|---|
6.042 ± 0.086 | 1.756 ± 0.035 |
4.586 ± 0.09 | 6.223 ± 0.079 |
5.536 ± 0.077 | 5.86 ± 0.088 |
2.569 ± 0.056 | 7.226 ± 0.067 |
7.584 ± 0.085 | 10.715 ± 0.078 |
Met |
Asn |
Gln |
Pro |
Arg |
Ser |
Thr |
Val |
Trp |
Tyr |
|---|---|---|---|---|---|---|---|---|---|
2.323 ± 0.042 | 4.395 ± 0.084 |
3.66 ± 0.043 | 4.371 ± 0.057 |
4.371 ± 0.071 | 7.552 ± 0.063 |
4.496 ± 0.056 | 6.138 ± 0.068 |
1.392 ± 0.04 | 3.204 ± 0.05 |
Most of the basic statistics you can see at this page can be downloaded from this CSV file
See this proteome in:

Proteome-pI is available under Creative Commons Attribution-NoDerivs license, for more details see here
| Reference: Kozlowski LP. Proteome-pI 2.0: Proteome Isoelectric Point Database Update. Nucleic Acids Res. 2021, doi: 10.1093/nar/gkab944 | Contact: Lukasz P. Kozlowski |