Trichoderma harzianum (Hypocrea lixii)
Taxonomy: cellular organisms; Eukaryota; Opisthokonta; Fungi; Dikarya; Ascomycota; saccharomyceta; Pezizomycotina; leotiomyceta; sordariomyceta; Sordariomycetes; Hypocreomycetidae; Hypocreales; Hypocreaceae; Trichoderma
Average proteome isoelectric point is 6.25
Get precalculated fractions of proteins
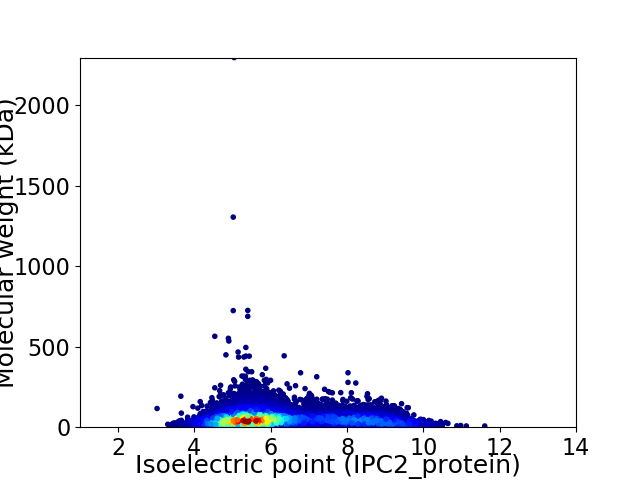
Virtual 2D-PAGE plot for 11497 proteins (isoelectric point calculated using IPC2_protein)
Get csv file with sequences according to given criteria:
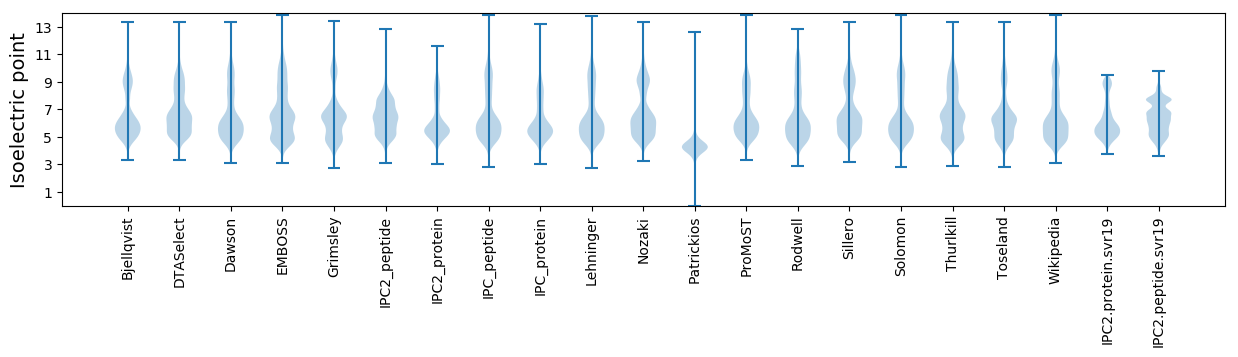
* You can choose from 21 different methods for calculating isoelectric point
Summary statistics related to proteome-wise predictions
Protein with the lowest isoelectric point:
>tr|A0A0G0AFP8|A0A0G0AFP8_TRIHA EthD domain-containing protein OS=Trichoderma harzianum OX=5544 GN=THAR02_04095 PE=3 SV=1
MM1 pKa = 7.44ATTTTPANDD10 pKa = 3.68LSTPLTTTWMGDD22 pKa = 3.73DD23 pKa = 4.13NGSKK27 pKa = 10.56YY28 pKa = 10.24SWHH31 pKa = 6.64SALTQQEE38 pKa = 4.51SSDD41 pKa = 3.87QEE43 pKa = 4.1DD44 pKa = 4.39DD45 pKa = 4.47GIQALGILPVEE56 pKa = 4.32MPNPDD61 pKa = 3.17SHH63 pKa = 6.91PFSSLIFPILSSLCFLPLPLL83 pKa = 5.74
MM1 pKa = 7.44ATTTTPANDD10 pKa = 3.68LSTPLTTTWMGDD22 pKa = 3.73DD23 pKa = 4.13NGSKK27 pKa = 10.56YY28 pKa = 10.24SWHH31 pKa = 6.64SALTQQEE38 pKa = 4.51SSDD41 pKa = 3.87QEE43 pKa = 4.1DD44 pKa = 4.39DD45 pKa = 4.47GIQALGILPVEE56 pKa = 4.32MPNPDD61 pKa = 3.17SHH63 pKa = 6.91PFSSLIFPILSSLCFLPLPLL83 pKa = 5.74
Molecular weight: 8.99 kDa
Isoelectric point according different methods:
Protein with the highest isoelectric point:
>tr|A0A0F9ZU58|A0A0F9ZU58_TRIHA Beta_elim_lyase domain-containing protein OS=Trichoderma harzianum OX=5544 GN=THAR02_11266 PE=3 SV=1
MM1 pKa = 7.64SSPTPRR7 pKa = 11.84SNPPSPTPRR16 pKa = 11.84STRR19 pKa = 11.84SPTPRR24 pKa = 11.84SSPSPTPRR32 pKa = 11.84SMSRR36 pKa = 11.84PTPPRR41 pKa = 11.84SSPLIFTLPSVLLLPPSLLAAPLIRR66 pKa = 11.84SPSRR70 pKa = 11.84LLL72 pKa = 3.61
MM1 pKa = 7.64SSPTPRR7 pKa = 11.84SNPPSPTPRR16 pKa = 11.84STRR19 pKa = 11.84SPTPRR24 pKa = 11.84SSPSPTPRR32 pKa = 11.84SMSRR36 pKa = 11.84PTPPRR41 pKa = 11.84SSPLIFTLPSVLLLPPSLLAAPLIRR66 pKa = 11.84SPSRR70 pKa = 11.84LLL72 pKa = 3.61
Molecular weight: 7.68 kDa
Isoelectric point according different methods:
Peptides (in silico digests for buttom-up proteomics)
Below you can find in silico digests of the whole proteome with Trypsin, Chymotrypsin, Trypsin+LysC, LysN, ArgC proteases suitable for different mass spec machines.| Try ESI |
 |
|---|
| ChTry ESI |
|
|---|
| ArgC ESI |
|
|---|
| LysN ESI |
|
|---|
| TryLysC ESI |
|
|---|
| Try MALDI |
|
|---|
| ChTry MALDI |
|
|---|
| ArgC MALDI |
|
|---|
| LysN MALDI |
|
|---|
| TryLysC MALDI |
|
|---|
| Try LTQ |
|
|---|
| ChTry LTQ |
|
|---|
| ArgC LTQ |
|
|---|
| LysN LTQ |
|
|---|
| TryLysC LTQ |
|
|---|
| Try MSlow |
|
|---|
| ChTry MSlow |
|
|---|
| ArgC MSlow |
|
|---|
| LysN MSlow |
|
|---|
| TryLysC MSlow |
|
|---|
| Try MShigh |
|
|---|
| ChTry MShigh |
|
|---|
| ArgC MShigh |
|
|---|
| LysN MShigh |
|
|---|
| TryLysC MShigh |
|
|---|
General Statistics
Number of major isoforms |
Number of additional isoforms |
Number of all proteins |
Number of amino acids |
Min. Seq. Length |
Max. Seq. Length |
Avg. Seq. Length |
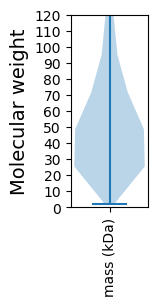
Avg. Mol. Weight |
|---|---|---|---|---|---|---|---|
0 |
5801780 |
18 |
20758 |
504.6 |
55.81 |
Amino acid frequency
Ala |
Cys |
Asp |
Glu |
Phe |
Gly |
His |
Ile |
Lys |
Leu |
|---|---|---|---|---|---|---|---|---|---|
8.794 ± 0.016 | 1.196 ± 0.008 |
5.84 ± 0.015 | 6.178 ± 0.022 |
3.769 ± 0.012 | 6.824 ± 0.025 |
2.345 ± 0.01 | 5.151 ± 0.017 |
4.907 ± 0.018 | 8.915 ± 0.025 |
Met |
Asn |
Gln |
Pro |
Arg |
Ser |
Thr |
Val |
Trp |
Tyr |
|---|---|---|---|---|---|---|---|---|---|
2.215 ± 0.009 | 3.762 ± 0.014 |
5.864 ± 0.024 | 4.075 ± 0.016 |
5.803 ± 0.019 | 8.19 ± 0.025 |
5.834 ± 0.015 | 6.091 ± 0.016 |
1.485 ± 0.008 | 2.76 ± 0.011 |
Most of the basic statistics you can see at this page can be downloaded from this CSV file
See this proteome in:

Proteome-pI is available under Creative Commons Attribution-NoDerivs license, for more details see here
| Reference: Kozlowski LP. Proteome-pI 2.0: Proteome Isoelectric Point Database Update. Nucleic Acids Res. 2021, doi: 10.1093/nar/gkab944 | Contact: Lukasz P. Kozlowski |