Croceibacter phage P2559Y
Taxonomy: Viruses; Duplodnaviria; Heunggongvirae; Uroviricota; Caudoviricetes; Caudovirales; Siphoviridae; unclassified Siphoviridae
Average proteome isoelectric point is 6.55
Get precalculated fractions of proteins
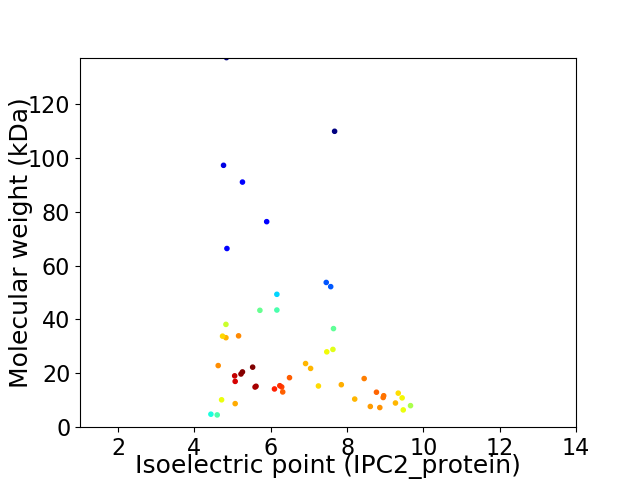
Virtual 2D-PAGE plot for 51 proteins (isoelectric point calculated using IPC2_protein)
Get csv file with sequences according to given criteria:
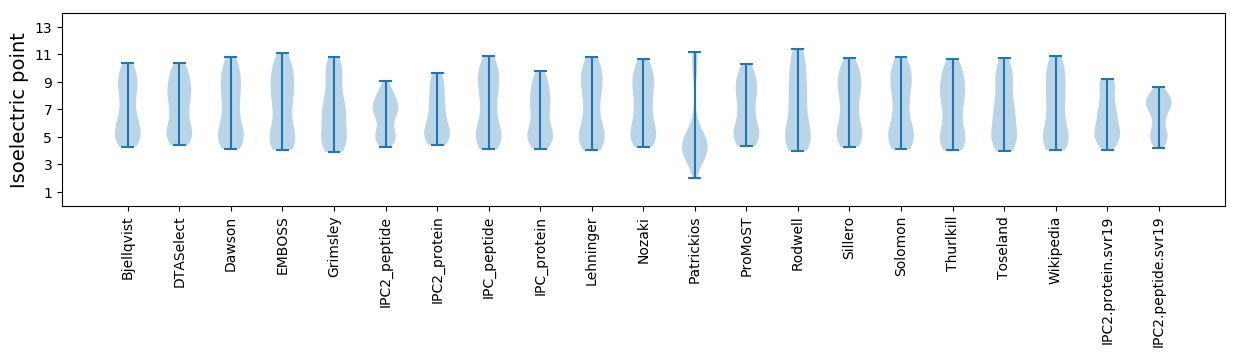
* You can choose from 21 different methods for calculating isoelectric point
Summary statistics related to proteome-wise predictions
Protein with the lowest isoelectric point:
>tr|W8CQM7|W8CQM7_9CAUD Putative tail protein OS=Croceibacter phage P2559Y OX=1327037 GN=P2559Y_0004 PE=4 SV=1
MM1 pKa = 7.67NFGTPQEE8 pKa = 4.7MIDD11 pKa = 3.83EE12 pKa = 4.64HH13 pKa = 7.69RR14 pKa = 11.84DD15 pKa = 3.36TYY17 pKa = 11.07PDD19 pKa = 3.7EE20 pKa = 4.94NSGCFPILLLIVFILVVLCITKK42 pKa = 10.42
MM1 pKa = 7.67NFGTPQEE8 pKa = 4.7MIDD11 pKa = 3.83EE12 pKa = 4.64HH13 pKa = 7.69RR14 pKa = 11.84DD15 pKa = 3.36TYY17 pKa = 11.07PDD19 pKa = 3.7EE20 pKa = 4.94NSGCFPILLLIVFILVVLCITKK42 pKa = 10.42
Molecular weight: 4.83 kDa
Isoelectric point according different methods:
Protein with the highest isoelectric point:
>tr|W8CPL4|W8CPL4_9CAUD Uncharacterized protein OS=Croceibacter phage P2559Y OX=1327037 GN=P2559Y_0037 PE=4 SV=1
MM1 pKa = 7.26QSKK4 pKa = 9.33KK5 pKa = 10.12QSWVEE10 pKa = 3.61AFTNTFVGFVISLTAIFLILPLFGVEE36 pKa = 3.93STPIKK41 pKa = 10.72NVGITLCFTVISILRR56 pKa = 11.84GYY58 pKa = 10.02LIRR61 pKa = 11.84RR62 pKa = 11.84FFNKK66 pKa = 9.42KK67 pKa = 9.2HH68 pKa = 5.88SKK70 pKa = 9.87
MM1 pKa = 7.26QSKK4 pKa = 9.33KK5 pKa = 10.12QSWVEE10 pKa = 3.61AFTNTFVGFVISLTAIFLILPLFGVEE36 pKa = 3.93STPIKK41 pKa = 10.72NVGITLCFTVISILRR56 pKa = 11.84GYY58 pKa = 10.02LIRR61 pKa = 11.84RR62 pKa = 11.84FFNKK66 pKa = 9.42KK67 pKa = 9.2HH68 pKa = 5.88SKK70 pKa = 9.87
Molecular weight: 8.0 kDa
Isoelectric point according different methods:
Peptides (in silico digests for buttom-up proteomics)
Below you can find in silico digests of the whole proteome with Trypsin, Chymotrypsin, Trypsin+LysC, LysN, ArgC proteases suitable for different mass spec machines.| Try ESI |
 |
|---|
| ChTry ESI |
|
|---|
| ArgC ESI |
|
|---|
| LysN ESI |
|
|---|
| TryLysC ESI |
|
|---|
| Try MALDI |
|
|---|
| ChTry MALDI |
|
|---|
| ArgC MALDI |
|
|---|
| LysN MALDI |
|
|---|
| TryLysC MALDI |
|
|---|
| Try LTQ |
|
|---|
| ChTry LTQ |
|
|---|
| ArgC LTQ |
|
|---|
| LysN LTQ |
|
|---|
| TryLysC LTQ |
|
|---|
| Try MSlow |
|
|---|
| ChTry MSlow |
|
|---|
| ArgC MSlow |
|
|---|
| LysN MSlow |
|
|---|
| TryLysC MSlow |
|
|---|
| Try MShigh |
|
|---|
| ChTry MShigh |
|
|---|
| ArgC MShigh |
|
|---|
| LysN MShigh |
|
|---|
| TryLysC MShigh |
|
|---|
General Statistics
Number of major isoforms |
Number of additional isoforms |
Number of all proteins |
Number of amino acids |
Min. Seq. Length |
Max. Seq. Length |
Avg. Seq. Length |
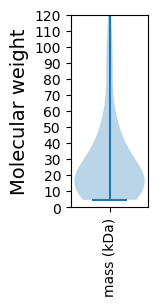
Avg. Mol. Weight |
|---|---|---|---|---|---|---|---|
0 |
13348 |
40 |
1248 |
261.7 |
29.62 |
Amino acid frequency
Ala |
Cys |
Asp |
Glu |
Phe |
Gly |
His |
Ile |
Lys |
Leu |
|---|---|---|---|---|---|---|---|---|---|
6.435 ± 0.631 | 0.944 ± 0.126 |
6.555 ± 0.263 | 6.75 ± 0.33 |
4.577 ± 0.249 | 6.39 ± 0.229 |
1.648 ± 0.17 | 7.312 ± 0.288 |
8.338 ± 0.383 | 8.376 ± 0.259 |
Met |
Asn |
Gln |
Pro |
Arg |
Ser |
Thr |
Val |
Trp |
Tyr |
|---|---|---|---|---|---|---|---|---|---|
1.985 ± 0.133 | 5.701 ± 0.285 |
3.701 ± 0.271 | 3.663 ± 0.203 |
3.873 ± 0.213 | 5.911 ± 0.221 |
6.398 ± 0.335 | 6.008 ± 0.239 |
1.416 ± 0.104 | 4.016 ± 0.301 |
Most of the basic statistics you can see at this page can be downloaded from this CSV file
See this proteome in:

Proteome-pI is available under Creative Commons Attribution-NoDerivs license, for more details see here
| Reference: Kozlowski LP. Proteome-pI 2.0: Proteome Isoelectric Point Database Update. Nucleic Acids Res. 2021, doi: 10.1093/nar/gkab944 | Contact: Lukasz P. Kozlowski |