Mycobacterium phage Brocalys
Taxonomy: Viruses; Duplodnaviria; Heunggongvirae; Uroviricota; Caudoviricetes; Caudovirales; Siphoviridae; Cheoctovirus; unclassified Cheoctovirus
Average proteome isoelectric point is 6.02
Get precalculated fractions of proteins
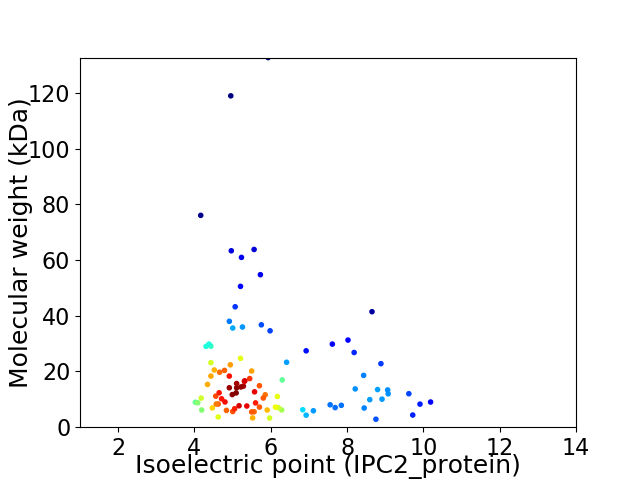
Virtual 2D-PAGE plot for 96 proteins (isoelectric point calculated using IPC2_protein)
Get csv file with sequences according to given criteria:
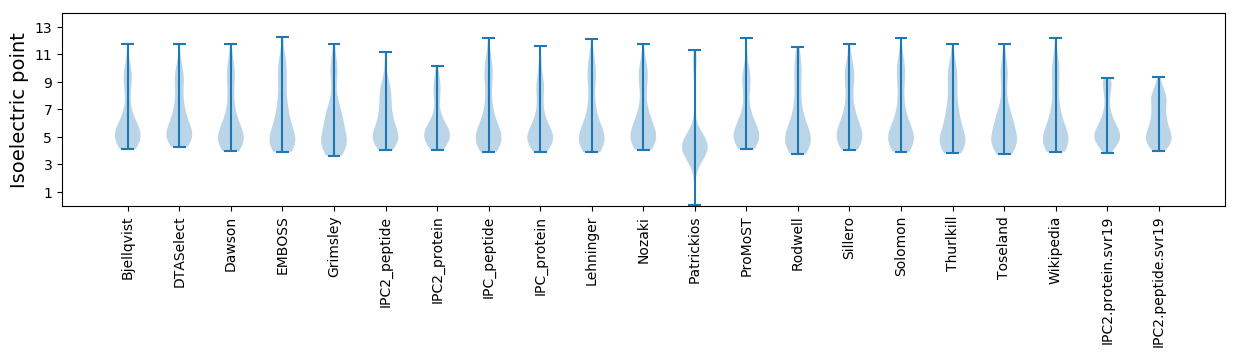
* You can choose from 21 different methods for calculating isoelectric point
Summary statistics related to proteome-wise predictions
Protein with the lowest isoelectric point:
>tr|A0A142K6J4|A0A142K6J4_9CAUD Minor tail protein OS=Mycobacterium phage Brocalys OX=1815608 GN=20 PE=4 SV=1
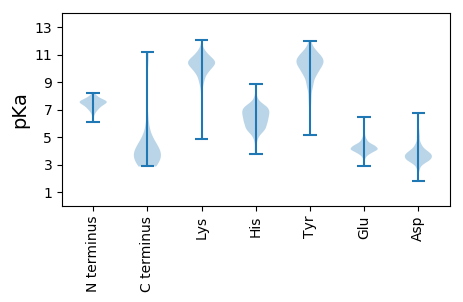
MM1 pKa = 7.89AYY3 pKa = 10.34AEE5 pKa = 4.99LLDD8 pKa = 3.81TDD10 pKa = 3.83MSTWCPITLHH20 pKa = 6.07YY21 pKa = 10.5KK22 pKa = 8.71VTDD25 pKa = 3.9GDD27 pKa = 3.94QVSYY31 pKa = 10.88LAVTRR36 pKa = 11.84VSFVTATGRR45 pKa = 11.84VEE47 pKa = 5.67AFACDD52 pKa = 3.61EE53 pKa = 4.2TGLAISLTPVWAIDD67 pKa = 3.44GDD69 pKa = 4.14VGHH72 pKa = 6.94NDD74 pKa = 3.21ALVAAGYY81 pKa = 7.32TVSS84 pKa = 3.59
MM1 pKa = 7.89AYY3 pKa = 10.34AEE5 pKa = 4.99LLDD8 pKa = 3.81TDD10 pKa = 3.83MSTWCPITLHH20 pKa = 6.07YY21 pKa = 10.5KK22 pKa = 8.71VTDD25 pKa = 3.9GDD27 pKa = 3.94QVSYY31 pKa = 10.88LAVTRR36 pKa = 11.84VSFVTATGRR45 pKa = 11.84VEE47 pKa = 5.67AFACDD52 pKa = 3.61EE53 pKa = 4.2TGLAISLTPVWAIDD67 pKa = 3.44GDD69 pKa = 4.14VGHH72 pKa = 6.94NDD74 pKa = 3.21ALVAAGYY81 pKa = 7.32TVSS84 pKa = 3.59
Molecular weight: 8.96 kDa
Isoelectric point according different methods:
Protein with the highest isoelectric point:
>tr|A0A142K6N7|A0A142K6N7_9CAUD Uncharacterized protein OS=Mycobacterium phage Brocalys OX=1815608 GN=63 PE=4 SV=1
MM1 pKa = 7.13TVEE4 pKa = 3.8SMLWFRR10 pKa = 11.84ARR12 pKa = 11.84RR13 pKa = 11.84RR14 pKa = 11.84SHH16 pKa = 6.55RR17 pKa = 11.84SAWGHH22 pKa = 5.8PRR24 pKa = 11.84PPAPPKK30 pKa = 9.37PQPTQGEE37 pKa = 4.39PMSNLTPEE45 pKa = 4.02QLEE48 pKa = 4.41AIAYY52 pKa = 8.8IVLAFTGPPSLAYY65 pKa = 10.09FLVKK69 pKa = 10.51GLFRR73 pKa = 6.02
MM1 pKa = 7.13TVEE4 pKa = 3.8SMLWFRR10 pKa = 11.84ARR12 pKa = 11.84RR13 pKa = 11.84RR14 pKa = 11.84SHH16 pKa = 6.55RR17 pKa = 11.84SAWGHH22 pKa = 5.8PRR24 pKa = 11.84PPAPPKK30 pKa = 9.37PQPTQGEE37 pKa = 4.39PMSNLTPEE45 pKa = 4.02QLEE48 pKa = 4.41AIAYY52 pKa = 8.8IVLAFTGPPSLAYY65 pKa = 10.09FLVKK69 pKa = 10.51GLFRR73 pKa = 6.02
Molecular weight: 8.29 kDa
Isoelectric point according different methods:
Peptides (in silico digests for buttom-up proteomics)
Below you can find in silico digests of the whole proteome with Trypsin, Chymotrypsin, Trypsin+LysC, LysN, ArgC proteases suitable for different mass spec machines.| Try ESI |
 |
|---|
| ChTry ESI |
|
|---|
| ArgC ESI |
|
|---|
| LysN ESI |
|
|---|
| TryLysC ESI |
|
|---|
| Try MALDI |
|
|---|
| ChTry MALDI |
|
|---|
| ArgC MALDI |
|
|---|
| LysN MALDI |
|
|---|
| TryLysC MALDI |
|
|---|
| Try LTQ |
|
|---|
| ChTry LTQ |
|
|---|
| ArgC LTQ |
|
|---|
| LysN LTQ |
|
|---|
| TryLysC LTQ |
|
|---|
| Try MSlow |
|
|---|
| ChTry MSlow |
|
|---|
| ArgC MSlow |
|
|---|
| LysN MSlow |
|
|---|
| TryLysC MSlow |
|
|---|
| Try MShigh |
|
|---|
| ChTry MShigh |
|
|---|
| ArgC MShigh |
|
|---|
| LysN MShigh |
|
|---|
| TryLysC MShigh |
|
|---|
General Statistics
Number of major isoforms |
Number of additional isoforms |
Number of all proteins |
Number of amino acids |
Min. Seq. Length |
Max. Seq. Length |
Avg. Seq. Length |
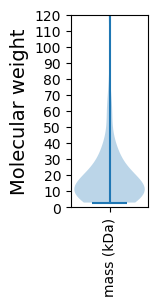
Avg. Mol. Weight |
|---|---|---|---|---|---|---|---|
0 |
17633 |
25 |
1183 |
183.7 |
20.18 |
Amino acid frequency
Ala |
Cys |
Asp |
Glu |
Phe |
Gly |
His |
Ile |
Lys |
Leu |
|---|---|---|---|---|---|---|---|---|---|
10.577 ± 0.451 | 1.27 ± 0.177 |
6.839 ± 0.213 | 6.062 ± 0.306 |
2.96 ± 0.18 | 8.365 ± 0.537 |
2.359 ± 0.212 | 4.31 ± 0.184 |
3.448 ± 0.171 | 7.537 ± 0.205 |
Met |
Asn |
Gln |
Pro |
Arg |
Ser |
Thr |
Val |
Trp |
Tyr |
|---|---|---|---|---|---|---|---|---|---|
2.268 ± 0.11 | 3.165 ± 0.15 |
6.131 ± 0.232 | 3.579 ± 0.156 |
7.174 ± 0.374 | 5.541 ± 0.203 |
6.522 ± 0.255 | 7.248 ± 0.267 |
2.24 ± 0.143 | 2.405 ± 0.183 |
Most of the basic statistics you can see at this page can be downloaded from this CSV file
See this proteome in:

Proteome-pI is available under Creative Commons Attribution-NoDerivs license, for more details see here
| Reference: Kozlowski LP. Proteome-pI 2.0: Proteome Isoelectric Point Database Update. Nucleic Acids Res. 2021, doi: 10.1093/nar/gkab944 | Contact: Lukasz P. Kozlowski |