Arachidicoccus soli
Taxonomy: cellular organisms; Bacteria; FCB group; Bacteroidetes/Chlorobi group; Bacteroidetes; Chitinophagia; Chitinophagales; Chitinophagaceae; Arachidicoccus
Average proteome isoelectric point is 7.02
Get precalculated fractions of proteins
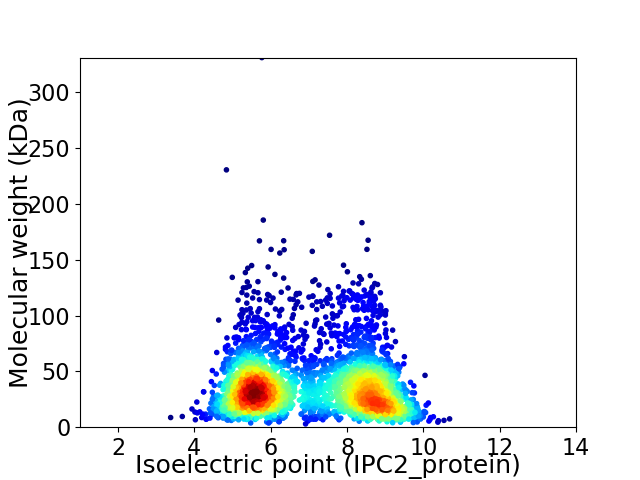
Virtual 2D-PAGE plot for 3298 proteins (isoelectric point calculated using IPC2_protein)
Get csv file with sequences according to given criteria:
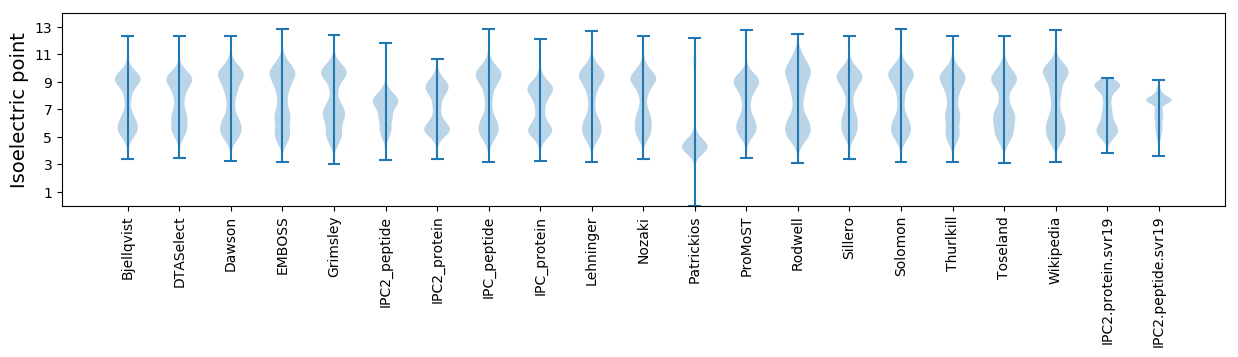
* You can choose from 21 different methods for calculating isoelectric point
Summary statistics related to proteome-wise predictions
Protein with the lowest isoelectric point:
>tr|A0A386HLF8|A0A386HLF8_9BACT ThuA domain-containing protein OS=Arachidicoccus soli OX=2341117 GN=D6B99_01790 PE=4 SV=1
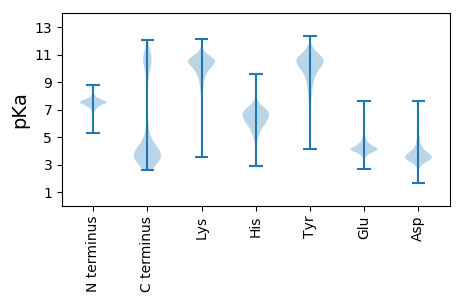
MM1 pKa = 7.83ADD3 pKa = 3.56YY4 pKa = 11.27NGLNLGGINGNHH16 pKa = 5.98NSINTGTNGQFSMFIIPNSAISTGGQSLTQSQIDD50 pKa = 3.75DD51 pKa = 4.0AGLSLVQANPGVFQQ65 pKa = 4.15
MM1 pKa = 7.83ADD3 pKa = 3.56YY4 pKa = 11.27NGLNLGGINGNHH16 pKa = 5.98NSINTGTNGQFSMFIIPNSAISTGGQSLTQSQIDD50 pKa = 3.75DD51 pKa = 4.0AGLSLVQANPGVFQQ65 pKa = 4.15
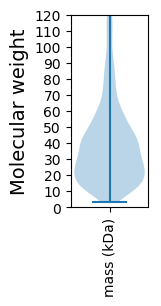
Molecular weight: 6.67 kDa
Isoelectric point according different methods:
Protein with the highest isoelectric point:
>tr|A0A386HU39|A0A386HU39_9BACT Alpha-mannosidase OS=Arachidicoccus soli OX=2341117 GN=D6B99_15765 PE=3 SV=1
MM1 pKa = 7.15QFLGGHH7 pKa = 5.57VDD9 pKa = 3.74DD10 pKa = 6.35LIVLVVFIYY19 pKa = 10.43LFLMVRR25 pKa = 11.84RR26 pKa = 11.84KK27 pKa = 10.27VSLSTQRR34 pKa = 11.84QAKK37 pKa = 9.67FEE39 pKa = 4.11NFMQQKK45 pKa = 8.8RR46 pKa = 11.84GKK48 pKa = 8.31FFRR51 pKa = 11.84IVVYY55 pKa = 10.83AGTALFAFIVLADD68 pKa = 3.46IMGWRR73 pKa = 11.84QQ74 pKa = 2.75
MM1 pKa = 7.15QFLGGHH7 pKa = 5.57VDD9 pKa = 3.74DD10 pKa = 6.35LIVLVVFIYY19 pKa = 10.43LFLMVRR25 pKa = 11.84RR26 pKa = 11.84KK27 pKa = 10.27VSLSTQRR34 pKa = 11.84QAKK37 pKa = 9.67FEE39 pKa = 4.11NFMQQKK45 pKa = 8.8RR46 pKa = 11.84GKK48 pKa = 8.31FFRR51 pKa = 11.84IVVYY55 pKa = 10.83AGTALFAFIVLADD68 pKa = 3.46IMGWRR73 pKa = 11.84QQ74 pKa = 2.75
Molecular weight: 8.7 kDa
Isoelectric point according different methods:
Peptides (in silico digests for buttom-up proteomics)
Below you can find in silico digests of the whole proteome with Trypsin, Chymotrypsin, Trypsin+LysC, LysN, ArgC proteases suitable for different mass spec machines.| Try ESI |
 |
|---|
| ChTry ESI |
|
|---|
| ArgC ESI |
|
|---|
| LysN ESI |
|
|---|
| TryLysC ESI |
|
|---|
| Try MALDI |
|
|---|
| ChTry MALDI |
|
|---|
| ArgC MALDI |
|
|---|
| LysN MALDI |
|
|---|
| TryLysC MALDI |
|
|---|
| Try LTQ |
|
|---|
| ChTry LTQ |
|
|---|
| ArgC LTQ |
|
|---|
| LysN LTQ |
|
|---|
| TryLysC LTQ |
|
|---|
| Try MSlow |
|
|---|
| ChTry MSlow |
|
|---|
| ArgC MSlow |
|
|---|
| LysN MSlow |
|
|---|
| TryLysC MSlow |
|
|---|
| Try MShigh |
|
|---|
| ChTry MShigh |
|
|---|
| ArgC MShigh |
|
|---|
| LysN MShigh |
|
|---|
| TryLysC MShigh |
|
|---|
General Statistics
Number of major isoforms |
Number of additional isoforms |
Number of all proteins |
Number of amino acids |
Min. Seq. Length |
Max. Seq. Length |
Avg. Seq. Length |
Avg. Mol. Weight |
|---|---|---|---|---|---|---|---|
0 |
1183952 |
25 |
2900 |
359.0 |
40.46 |
Amino acid frequency
Ala |
Cys |
Asp |
Glu |
Phe |
Gly |
His |
Ile |
Lys |
Leu |
|---|---|---|---|---|---|---|---|---|---|
6.988 ± 0.035 | 0.877 ± 0.012 |
5.185 ± 0.027 | 5.589 ± 0.044 |
5.018 ± 0.027 | 6.615 ± 0.036 |
1.947 ± 0.017 | 7.851 ± 0.039 |
7.562 ± 0.035 | 9.238 ± 0.044 |
Met |
Asn |
Gln |
Pro |
Arg |
Ser |
Thr |
Val |
Trp |
Tyr |
|---|---|---|---|---|---|---|---|---|---|
2.323 ± 0.02 | 6.305 ± 0.046 |
3.715 ± 0.024 | 3.827 ± 0.026 |
3.59 ± 0.025 | 6.508 ± 0.034 |
5.522 ± 0.027 | 5.741 ± 0.033 |
1.342 ± 0.019 | 4.26 ± 0.032 |
Most of the basic statistics you can see at this page can be downloaded from this CSV file
See this proteome in:

Proteome-pI is available under Creative Commons Attribution-NoDerivs license, for more details see here
| Reference: Kozlowski LP. Proteome-pI 2.0: Proteome Isoelectric Point Database Update. Nucleic Acids Res. 2021, doi: 10.1093/nar/gkab944 | Contact: Lukasz P. Kozlowski |