Leucobacter komagatae
Taxonomy: cellular organisms; Bacteria; Terrabacteria group; Actinobacteria; Actinomycetia; Micrococcales;
Average proteome isoelectric point is 5.98
Get precalculated fractions of proteins
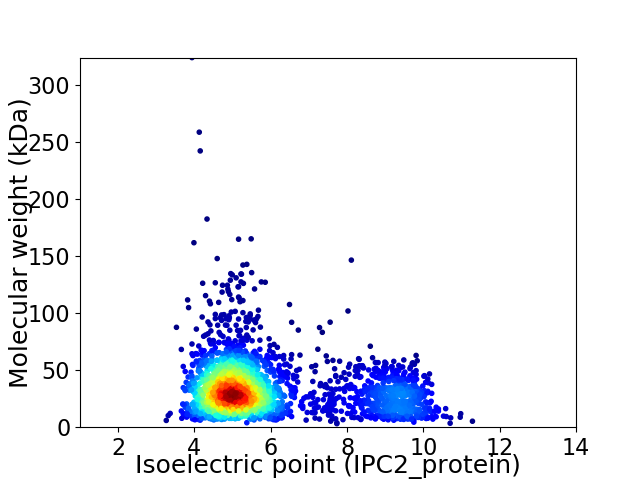
Virtual 2D-PAGE plot for 2703 proteins (isoelectric point calculated using IPC2_protein)
Get csv file with sequences according to given criteria:
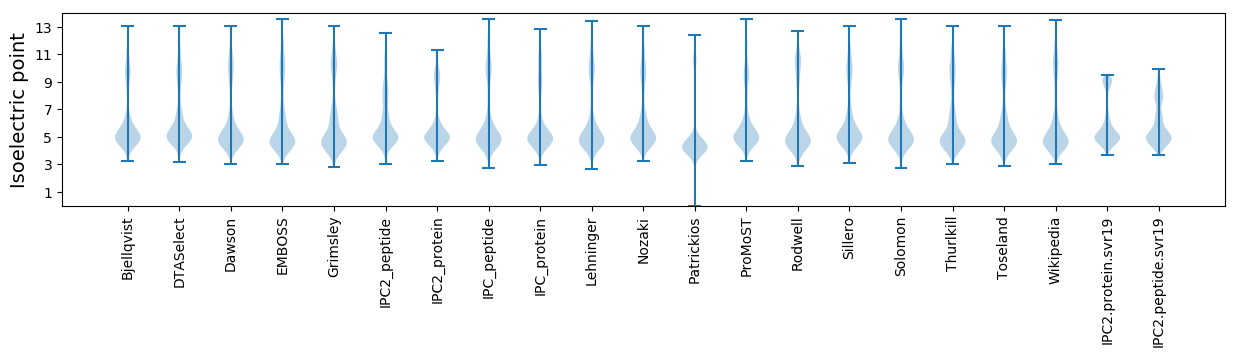
* You can choose from 21 different methods for calculating isoelectric point
Summary statistics related to proteome-wise predictions
Protein with the lowest isoelectric point:
>tr|A0A0D0HVG9|A0A0D0HVG9_9MICO Peptidyl-prolyl cis-trans isomerase OS=Leucobacter komagatae OX=55969 GN=SD72_14515 PE=3 SV=1
II1 pKa = 6.54ITTNGTEE8 pKa = 4.1PQNPLITYY16 pKa = 7.69ATTEE20 pKa = 3.98VGGGKK25 pKa = 9.38ILTAMYY31 pKa = 10.3AGLVSFTASGEE42 pKa = 4.1IEE44 pKa = 4.24NEE46 pKa = 3.91VAEE49 pKa = 4.82SIEE52 pKa = 4.32SDD54 pKa = 4.67DD55 pKa = 3.74AALWTITIEE64 pKa = 4.73DD65 pKa = 3.69GWTFSDD71 pKa = 4.59GEE73 pKa = 4.68AITAQTFVDD82 pKa = 3.66TWTNAAVDD90 pKa = 3.55PAGAYY95 pKa = 8.36WFGNIEE101 pKa = 4.13GTTEE105 pKa = 4.01EE106 pKa = 5.38GDD108 pKa = 3.71TAPTGLTVVDD118 pKa = 4.91DD119 pKa = 3.98LTFTVQLKK127 pKa = 7.83TAEE130 pKa = 4.07ADD132 pKa = 3.65FPLRR136 pKa = 11.84LAYY139 pKa = 8.24TAYY142 pKa = 10.08MPLPSAAFDD151 pKa = 3.62DD152 pKa = 4.25MEE154 pKa = 5.75AFGEE158 pKa = 4.12NPIGNGPYY166 pKa = 9.65MLDD169 pKa = 3.78GEE171 pKa = 4.86GAWRR175 pKa = 11.84HH176 pKa = 5.09EE177 pKa = 4.5EE178 pKa = 4.2GVSLVTNPTYY188 pKa = 10.75DD189 pKa = 3.64GNRR192 pKa = 11.84KK193 pKa = 8.15PVNGGLEE200 pKa = 3.93FVFYY204 pKa = 11.15NDD206 pKa = 4.03LASAYY211 pKa = 10.58ADD213 pKa = 3.48AQSGNLDD220 pKa = 3.66ILDD223 pKa = 4.43SVPDD227 pKa = 3.95TAFGTYY233 pKa = 7.48QTDD236 pKa = 3.75FPDD239 pKa = 3.59RR240 pKa = 11.84FVNEE244 pKa = 3.89PAAIFQGFNIPYY256 pKa = 8.54YY257 pKa = 10.21IPNFEE262 pKa = 5.08DD263 pKa = 4.14GEE265 pKa = 4.28EE266 pKa = 4.32GKK268 pKa = 10.44LRR270 pKa = 11.84RR271 pKa = 11.84AAISMSIDD279 pKa = 3.02RR280 pKa = 11.84AEE282 pKa = 3.76ITEE285 pKa = 4.56TIFQEE290 pKa = 4.23TRR292 pKa = 11.84TPATDD297 pKa = 3.47FTSPVLPGWTDD308 pKa = 3.22SLAGAEE314 pKa = 4.1VLDD317 pKa = 4.35YY318 pKa = 11.29NPEE321 pKa = 3.76EE322 pKa = 4.17AVRR325 pKa = 11.84LWEE328 pKa = 4.22QADD331 pKa = 3.37ALAPYY336 pKa = 9.99EE337 pKa = 4.37GTFTLAYY344 pKa = 9.87NADD347 pKa = 4.01GGHH350 pKa = 5.32QAWVDD355 pKa = 3.32AVTNSISNTLGIAAEE370 pKa = 4.32GLSLPTFAAALDD382 pKa = 3.85QRR384 pKa = 11.84SSGTLTGATRR394 pKa = 11.84SGWQGDD400 pKa = 4.21FPTQANFLSPLYY412 pKa = 9.79STGGSSNYY420 pKa = 9.81EE421 pKa = 4.36GYY423 pKa = 10.88SSAAFDD429 pKa = 3.84AKK431 pKa = 10.67LGEE434 pKa = 4.19AAAASSIEE442 pKa = 3.94EE443 pKa = 4.47SIDD446 pKa = 3.59LYY448 pKa = 11.39HH449 pKa = 6.87EE450 pKa = 4.22AQEE453 pKa = 4.47ILLEE457 pKa = 4.47DD458 pKa = 4.52LPAIPLWYY466 pKa = 10.3SNAVGVWGDD475 pKa = 3.47DD476 pKa = 3.51LEE478 pKa = 4.54NVVFGWDD485 pKa = 3.67SVPLHH490 pKa = 5.72HH491 pKa = 7.11QITKK495 pKa = 10.22GG496 pKa = 3.28
II1 pKa = 6.54ITTNGTEE8 pKa = 4.1PQNPLITYY16 pKa = 7.69ATTEE20 pKa = 3.98VGGGKK25 pKa = 9.38ILTAMYY31 pKa = 10.3AGLVSFTASGEE42 pKa = 4.1IEE44 pKa = 4.24NEE46 pKa = 3.91VAEE49 pKa = 4.82SIEE52 pKa = 4.32SDD54 pKa = 4.67DD55 pKa = 3.74AALWTITIEE64 pKa = 4.73DD65 pKa = 3.69GWTFSDD71 pKa = 4.59GEE73 pKa = 4.68AITAQTFVDD82 pKa = 3.66TWTNAAVDD90 pKa = 3.55PAGAYY95 pKa = 8.36WFGNIEE101 pKa = 4.13GTTEE105 pKa = 4.01EE106 pKa = 5.38GDD108 pKa = 3.71TAPTGLTVVDD118 pKa = 4.91DD119 pKa = 3.98LTFTVQLKK127 pKa = 7.83TAEE130 pKa = 4.07ADD132 pKa = 3.65FPLRR136 pKa = 11.84LAYY139 pKa = 8.24TAYY142 pKa = 10.08MPLPSAAFDD151 pKa = 3.62DD152 pKa = 4.25MEE154 pKa = 5.75AFGEE158 pKa = 4.12NPIGNGPYY166 pKa = 9.65MLDD169 pKa = 3.78GEE171 pKa = 4.86GAWRR175 pKa = 11.84HH176 pKa = 5.09EE177 pKa = 4.5EE178 pKa = 4.2GVSLVTNPTYY188 pKa = 10.75DD189 pKa = 3.64GNRR192 pKa = 11.84KK193 pKa = 8.15PVNGGLEE200 pKa = 3.93FVFYY204 pKa = 11.15NDD206 pKa = 4.03LASAYY211 pKa = 10.58ADD213 pKa = 3.48AQSGNLDD220 pKa = 3.66ILDD223 pKa = 4.43SVPDD227 pKa = 3.95TAFGTYY233 pKa = 7.48QTDD236 pKa = 3.75FPDD239 pKa = 3.59RR240 pKa = 11.84FVNEE244 pKa = 3.89PAAIFQGFNIPYY256 pKa = 8.54YY257 pKa = 10.21IPNFEE262 pKa = 5.08DD263 pKa = 4.14GEE265 pKa = 4.28EE266 pKa = 4.32GKK268 pKa = 10.44LRR270 pKa = 11.84RR271 pKa = 11.84AAISMSIDD279 pKa = 3.02RR280 pKa = 11.84AEE282 pKa = 3.76ITEE285 pKa = 4.56TIFQEE290 pKa = 4.23TRR292 pKa = 11.84TPATDD297 pKa = 3.47FTSPVLPGWTDD308 pKa = 3.22SLAGAEE314 pKa = 4.1VLDD317 pKa = 4.35YY318 pKa = 11.29NPEE321 pKa = 3.76EE322 pKa = 4.17AVRR325 pKa = 11.84LWEE328 pKa = 4.22QADD331 pKa = 3.37ALAPYY336 pKa = 9.99EE337 pKa = 4.37GTFTLAYY344 pKa = 9.87NADD347 pKa = 4.01GGHH350 pKa = 5.32QAWVDD355 pKa = 3.32AVTNSISNTLGIAAEE370 pKa = 4.32GLSLPTFAAALDD382 pKa = 3.85QRR384 pKa = 11.84SSGTLTGATRR394 pKa = 11.84SGWQGDD400 pKa = 4.21FPTQANFLSPLYY412 pKa = 9.79STGGSSNYY420 pKa = 9.81EE421 pKa = 4.36GYY423 pKa = 10.88SSAAFDD429 pKa = 3.84AKK431 pKa = 10.67LGEE434 pKa = 4.19AAAASSIEE442 pKa = 3.94EE443 pKa = 4.47SIDD446 pKa = 3.59LYY448 pKa = 11.39HH449 pKa = 6.87EE450 pKa = 4.22AQEE453 pKa = 4.47ILLEE457 pKa = 4.47DD458 pKa = 4.52LPAIPLWYY466 pKa = 10.3SNAVGVWGDD475 pKa = 3.47DD476 pKa = 3.51LEE478 pKa = 4.54NVVFGWDD485 pKa = 3.67SVPLHH490 pKa = 5.72HH491 pKa = 7.11QITKK495 pKa = 10.22GG496 pKa = 3.28
Molecular weight: 53.3 kDa
Isoelectric point according different methods:
Protein with the highest isoelectric point:
>tr|A0A0D0HUF5|A0A0D0HUF5_9MICO DNA gyrase subunit B OS=Leucobacter komagatae OX=55969 GN=gyrB PE=3 SV=1
MM1 pKa = 7.69SKK3 pKa = 9.0RR4 pKa = 11.84TFQPNNRR11 pKa = 11.84RR12 pKa = 11.84RR13 pKa = 11.84AKK15 pKa = 9.23VHH17 pKa = 5.46GFRR20 pKa = 11.84SRR22 pKa = 11.84MRR24 pKa = 11.84TRR26 pKa = 11.84AGRR29 pKa = 11.84AIITARR35 pKa = 11.84RR36 pKa = 11.84GKK38 pKa = 10.68GRR40 pKa = 11.84TKK42 pKa = 10.85LSAA45 pKa = 3.61
MM1 pKa = 7.69SKK3 pKa = 9.0RR4 pKa = 11.84TFQPNNRR11 pKa = 11.84RR12 pKa = 11.84RR13 pKa = 11.84AKK15 pKa = 9.23VHH17 pKa = 5.46GFRR20 pKa = 11.84SRR22 pKa = 11.84MRR24 pKa = 11.84TRR26 pKa = 11.84AGRR29 pKa = 11.84AIITARR35 pKa = 11.84RR36 pKa = 11.84GKK38 pKa = 10.68GRR40 pKa = 11.84TKK42 pKa = 10.85LSAA45 pKa = 3.61
Molecular weight: 5.24 kDa
Isoelectric point according different methods:
Peptides (in silico digests for buttom-up proteomics)
Below you can find in silico digests of the whole proteome with Trypsin, Chymotrypsin, Trypsin+LysC, LysN, ArgC proteases suitable for different mass spec machines.| Try ESI |
 |
|---|
| ChTry ESI |
|
|---|
| ArgC ESI |
|
|---|
| LysN ESI |
|
|---|
| TryLysC ESI |
|
|---|
| Try MALDI |
|
|---|
| ChTry MALDI |
|
|---|
| ArgC MALDI |
|
|---|
| LysN MALDI |
|
|---|
| TryLysC MALDI |
|
|---|
| Try LTQ |
|
|---|
| ChTry LTQ |
|
|---|
| ArgC LTQ |
|
|---|
| LysN LTQ |
|
|---|
| TryLysC LTQ |
|
|---|
| Try MSlow |
|
|---|
| ChTry MSlow |
|
|---|
| ArgC MSlow |
|
|---|
| LysN MSlow |
|
|---|
| TryLysC MSlow |
|
|---|
| Try MShigh |
|
|---|
| ChTry MShigh |
|
|---|
| ArgC MShigh |
|
|---|
| LysN MShigh |
|
|---|
| TryLysC MShigh |
|
|---|
General Statistics
Number of major isoforms |
Number of additional isoforms |
Number of all proteins |
Number of amino acids |
Min. Seq. Length |
Max. Seq. Length |
Avg. Seq. Length |
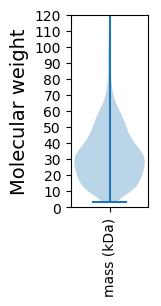
Avg. Mol. Weight |
|---|---|---|---|---|---|---|---|
0 |
881507 |
29 |
3160 |
326.1 |
34.81 |
Amino acid frequency
Ala |
Cys |
Asp |
Glu |
Phe |
Gly |
His |
Ile |
Lys |
Leu |
|---|---|---|---|---|---|---|---|---|---|
13.42 ± 0.057 | 0.495 ± 0.011 |
5.624 ± 0.044 | 6.247 ± 0.042 |
3.263 ± 0.031 | 9.103 ± 0.043 |
1.897 ± 0.021 | 4.758 ± 0.032 |
2.29 ± 0.035 | 10.218 ± 0.054 |
Met |
Asn |
Gln |
Pro |
Arg |
Ser |
Thr |
Val |
Trp |
Tyr |
|---|---|---|---|---|---|---|---|---|---|
1.872 ± 0.019 | 2.232 ± 0.027 |
5.154 ± 0.028 | 2.948 ± 0.024 |
6.661 ± 0.054 | 5.878 ± 0.027 |
6.118 ± 0.045 | 8.553 ± 0.045 |
1.353 ± 0.02 | 1.916 ± 0.021 |
Most of the basic statistics you can see at this page can be downloaded from this CSV file
See this proteome in:

Proteome-pI is available under Creative Commons Attribution-NoDerivs license, for more details see here
| Reference: Kozlowski LP. Proteome-pI 2.0: Proteome Isoelectric Point Database Update. Nucleic Acids Res. 2021, doi: 10.1093/nar/gkab944 | Contact: Lukasz P. Kozlowski |