Lymphocystis disease virus Sa
Taxonomy: Viruses; Varidnaviria; Bamfordvirae; Nucleocytoviricota; Megaviricetes; Pimascovirales; Iridoviridae; Alphairidovirinae; Lymphocystivirus; unclassified Lymphocystivirus
Average proteome isoelectric point is 7.59
Get precalculated fractions of proteins
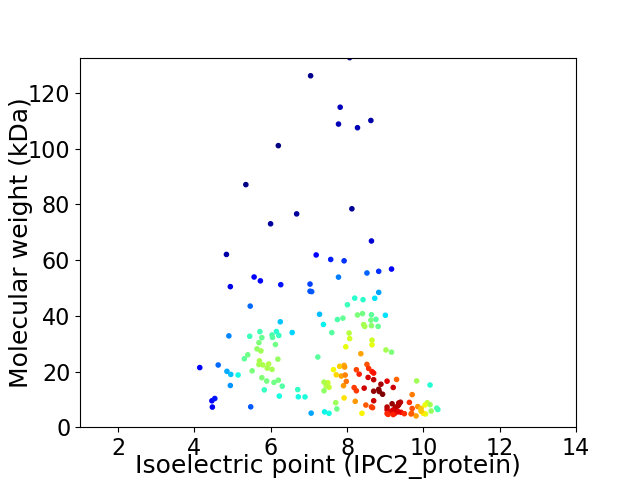
Virtual 2D-PAGE plot for 183 proteins (isoelectric point calculated using IPC2_protein)
Get csv file with sequences according to given criteria:
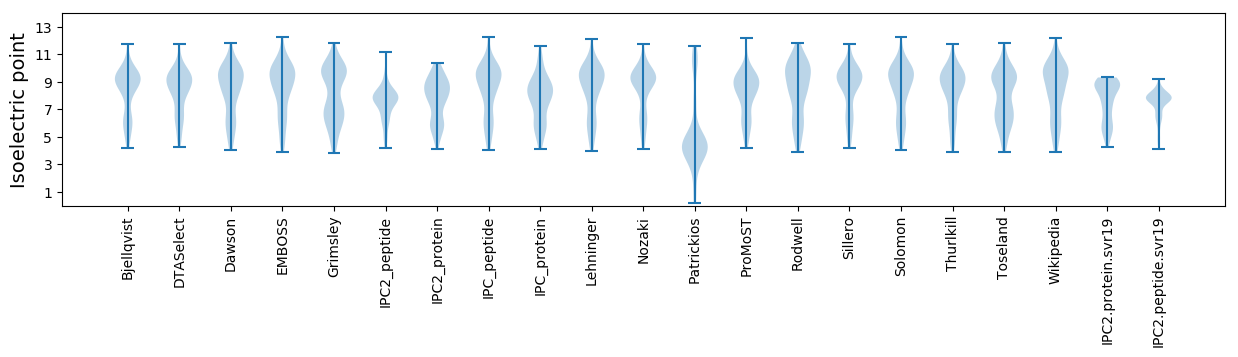
* You can choose from 21 different methods for calculating isoelectric point
Summary statistics related to proteome-wise predictions
Protein with the lowest isoelectric point:
>tr|A0A1B2RVT8|A0A1B2RVT8_9VIRU Uncharacterized protein OS=Lymphocystis disease virus Sa OX=1898060 GN=LCDVSa028R PE=4 SV=1
MM1 pKa = 7.64FSTSYY6 pKa = 10.6QPPQFVNLNQPPPPEE21 pKa = 4.31PKK23 pKa = 9.92KK24 pKa = 10.77EE25 pKa = 3.94MSKK28 pKa = 10.51SKK30 pKa = 10.28PISEE34 pKa = 4.73PYY36 pKa = 10.46AFGYY40 pKa = 9.94LPPSVEE46 pKa = 3.91DD47 pKa = 3.51DD48 pKa = 3.99VVVEE52 pKa = 4.4EE53 pKa = 4.42PLEE56 pKa = 4.1EE57 pKa = 4.27SEE59 pKa = 5.17EE60 pKa = 4.19EE61 pKa = 3.53IDD63 pKa = 4.62YY64 pKa = 11.4GDD66 pKa = 4.25EE67 pKa = 4.23EE68 pKa = 4.49PVLTEE73 pKa = 3.6EE74 pKa = 4.45GNIVFDD80 pKa = 3.88EE81 pKa = 4.59DD82 pKa = 3.49VDD84 pKa = 4.27EE85 pKa = 4.75EE86 pKa = 4.51EE87 pKa = 4.89EE88 pKa = 4.27DD89 pKa = 3.7EE90 pKa = 4.6KK91 pKa = 11.56LQTVEE96 pKa = 5.27DD97 pKa = 3.89KK98 pKa = 10.08THH100 pKa = 6.27VYY102 pKa = 10.66LFLEE106 pKa = 4.98DD107 pKa = 3.52YY108 pKa = 11.22SNRR111 pKa = 11.84EE112 pKa = 3.52NSLLPFVAMLNPVEE126 pKa = 3.9QWNIIKK132 pKa = 10.41KK133 pKa = 10.4ALFTGFTKK141 pKa = 10.38VDD143 pKa = 3.63GLEE146 pKa = 4.13KK147 pKa = 10.92VADD150 pKa = 4.01KK151 pKa = 10.84YY152 pKa = 11.26IKK154 pKa = 10.5LVADD158 pKa = 5.37AILINRR164 pKa = 11.84DD165 pKa = 3.4QIEE168 pKa = 4.28DD169 pKa = 4.08HH170 pKa = 6.05PTSYY174 pKa = 11.49YY175 pKa = 9.81FLSYY179 pKa = 10.68AKK181 pKa = 10.43SRR183 pKa = 11.84GLVV186 pKa = 3.14
MM1 pKa = 7.64FSTSYY6 pKa = 10.6QPPQFVNLNQPPPPEE21 pKa = 4.31PKK23 pKa = 9.92KK24 pKa = 10.77EE25 pKa = 3.94MSKK28 pKa = 10.51SKK30 pKa = 10.28PISEE34 pKa = 4.73PYY36 pKa = 10.46AFGYY40 pKa = 9.94LPPSVEE46 pKa = 3.91DD47 pKa = 3.51DD48 pKa = 3.99VVVEE52 pKa = 4.4EE53 pKa = 4.42PLEE56 pKa = 4.1EE57 pKa = 4.27SEE59 pKa = 5.17EE60 pKa = 4.19EE61 pKa = 3.53IDD63 pKa = 4.62YY64 pKa = 11.4GDD66 pKa = 4.25EE67 pKa = 4.23EE68 pKa = 4.49PVLTEE73 pKa = 3.6EE74 pKa = 4.45GNIVFDD80 pKa = 3.88EE81 pKa = 4.59DD82 pKa = 3.49VDD84 pKa = 4.27EE85 pKa = 4.75EE86 pKa = 4.51EE87 pKa = 4.89EE88 pKa = 4.27DD89 pKa = 3.7EE90 pKa = 4.6KK91 pKa = 11.56LQTVEE96 pKa = 5.27DD97 pKa = 3.89KK98 pKa = 10.08THH100 pKa = 6.27VYY102 pKa = 10.66LFLEE106 pKa = 4.98DD107 pKa = 3.52YY108 pKa = 11.22SNRR111 pKa = 11.84EE112 pKa = 3.52NSLLPFVAMLNPVEE126 pKa = 3.9QWNIIKK132 pKa = 10.41KK133 pKa = 10.4ALFTGFTKK141 pKa = 10.38VDD143 pKa = 3.63GLEE146 pKa = 4.13KK147 pKa = 10.92VADD150 pKa = 4.01KK151 pKa = 10.84YY152 pKa = 11.26IKK154 pKa = 10.5LVADD158 pKa = 5.37AILINRR164 pKa = 11.84DD165 pKa = 3.4QIEE168 pKa = 4.28DD169 pKa = 4.08HH170 pKa = 6.05PTSYY174 pKa = 11.49YY175 pKa = 9.81FLSYY179 pKa = 10.68AKK181 pKa = 10.43SRR183 pKa = 11.84GLVV186 pKa = 3.14
Molecular weight: 21.42 kDa
Isoelectric point according different methods:
Protein with the highest isoelectric point:
>tr|A0A1B2RW49|A0A1B2RW49_9VIRU Uncharacterized protein OS=Lymphocystis disease virus Sa OX=1898060 GN=LCDVSa122R PE=4 SV=1
MM1 pKa = 7.42NATSIPNTSLVYY13 pKa = 10.97GEE15 pKa = 4.97VNFLTLNHH23 pKa = 6.3SRR25 pKa = 11.84TIAFIQRR32 pKa = 11.84RR33 pKa = 11.84CWQSPLNVLNKK44 pKa = 9.29RR45 pKa = 11.84QFIIRR50 pKa = 11.84IPSSLRR56 pKa = 11.84INFLKK61 pKa = 10.09TKK63 pKa = 9.8NLHH66 pKa = 5.89RR67 pKa = 11.84FNLLRR72 pKa = 11.84IVRR75 pKa = 11.84FNTLRR80 pKa = 11.84LPLEE84 pKa = 4.22YY85 pKa = 10.76VSVNRR90 pKa = 11.84PSFYY94 pKa = 11.02YY95 pKa = 10.34LFSMEE100 pKa = 5.42LNLLTLKK107 pKa = 10.42YY108 pKa = 10.51IKK110 pKa = 10.1IVEE113 pKa = 4.16NKK115 pKa = 9.96LICLYY120 pKa = 10.92SGILTLIPCIINAVNSSDD138 pKa = 4.4ANTSSS143 pKa = 3.1
MM1 pKa = 7.42NATSIPNTSLVYY13 pKa = 10.97GEE15 pKa = 4.97VNFLTLNHH23 pKa = 6.3SRR25 pKa = 11.84TIAFIQRR32 pKa = 11.84RR33 pKa = 11.84CWQSPLNVLNKK44 pKa = 9.29RR45 pKa = 11.84QFIIRR50 pKa = 11.84IPSSLRR56 pKa = 11.84INFLKK61 pKa = 10.09TKK63 pKa = 9.8NLHH66 pKa = 5.89RR67 pKa = 11.84FNLLRR72 pKa = 11.84IVRR75 pKa = 11.84FNTLRR80 pKa = 11.84LPLEE84 pKa = 4.22YY85 pKa = 10.76VSVNRR90 pKa = 11.84PSFYY94 pKa = 11.02YY95 pKa = 10.34LFSMEE100 pKa = 5.42LNLLTLKK107 pKa = 10.42YY108 pKa = 10.51IKK110 pKa = 10.1IVEE113 pKa = 4.16NKK115 pKa = 9.96LICLYY120 pKa = 10.92SGILTLIPCIINAVNSSDD138 pKa = 4.4ANTSSS143 pKa = 3.1
Molecular weight: 16.63 kDa
Isoelectric point according different methods:
Peptides (in silico digests for buttom-up proteomics)
Below you can find in silico digests of the whole proteome with Trypsin, Chymotrypsin, Trypsin+LysC, LysN, ArgC proteases suitable for different mass spec machines.| Try ESI |
 |
|---|
| ChTry ESI |
|
|---|
| ArgC ESI |
|
|---|
| LysN ESI |
|
|---|
| TryLysC ESI |
|
|---|
| Try MALDI |
|
|---|
| ChTry MALDI |
|
|---|
| ArgC MALDI |
|
|---|
| LysN MALDI |
|
|---|
| TryLysC MALDI |
|
|---|
| Try LTQ |
|
|---|
| ChTry LTQ |
|
|---|
| ArgC LTQ |
|
|---|
| LysN LTQ |
|
|---|
| TryLysC LTQ |
|
|---|
| Try MSlow |
|
|---|
| ChTry MSlow |
|
|---|
| ArgC MSlow |
|
|---|
| LysN MSlow |
|
|---|
| TryLysC MSlow |
|
|---|
| Try MShigh |
|
|---|
| ChTry MShigh |
|
|---|
| ArgC MShigh |
|
|---|
| LysN MShigh |
|
|---|
| TryLysC MShigh |
|
|---|
General Statistics
Number of major isoforms |
Number of additional isoforms |
Number of all proteins |
Number of amino acids |
Min. Seq. Length |
Max. Seq. Length |
Avg. Seq. Length |
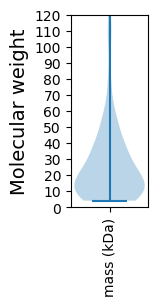
Avg. Mol. Weight |
|---|---|---|---|---|---|---|---|
0 |
43300 |
34 |
1183 |
236.6 |
27.33 |
Amino acid frequency
Ala |
Cys |
Asp |
Glu |
Phe |
Gly |
His |
Ile |
Lys |
Leu |
|---|---|---|---|---|---|---|---|---|---|
4.413 ± 0.142 | 2.39 ± 0.114 |
5.744 ± 0.155 | 6.111 ± 0.199 |
5.543 ± 0.158 | 4.187 ± 0.266 |
1.564 ± 0.079 | 7.298 ± 0.162 |
9.561 ± 0.232 | 10.321 ± 0.175 |
Met |
Asn |
Gln |
Pro |
Arg |
Ser |
Thr |
Val |
Trp |
Tyr |
|---|---|---|---|---|---|---|---|---|---|
1.778 ± 0.075 | 5.478 ± 0.147 |
3.912 ± 0.197 | 2.751 ± 0.091 |
4.321 ± 0.128 | 6.314 ± 0.147 |
5.587 ± 0.176 | 6.797 ± 0.161 |
0.952 ± 0.06 | 4.979 ± 0.171 |
Most of the basic statistics you can see at this page can be downloaded from this CSV file
See this proteome in:

Proteome-pI is available under Creative Commons Attribution-NoDerivs license, for more details see here
| Reference: Kozlowski LP. Proteome-pI 2.0: Proteome Isoelectric Point Database Update. Nucleic Acids Res. 2021, doi: 10.1093/nar/gkab944 | Contact: Lukasz P. Kozlowski |