Kribbella antibiotica
Taxonomy: cellular organisms; Bacteria; Terrabacteria group; Actinobacteria; Actinomycetia; Propionibacteriales; Kribbellaceae; Kribbella
Average proteome isoelectric point is 6.22
Get precalculated fractions of proteins
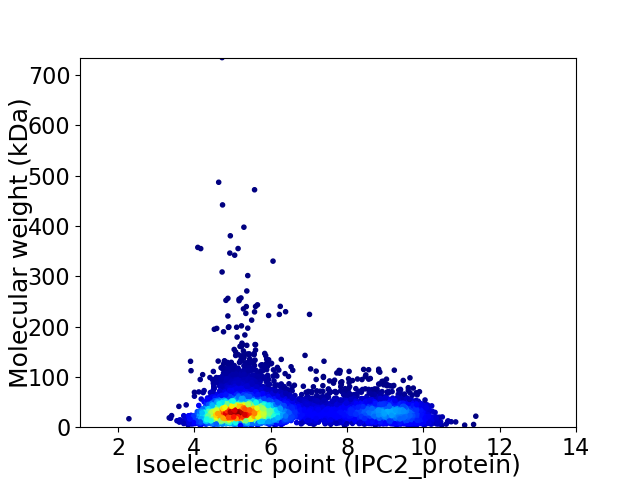
Virtual 2D-PAGE plot for 8290 proteins (isoelectric point calculated using IPC2_protein)
Get csv file with sequences according to given criteria:
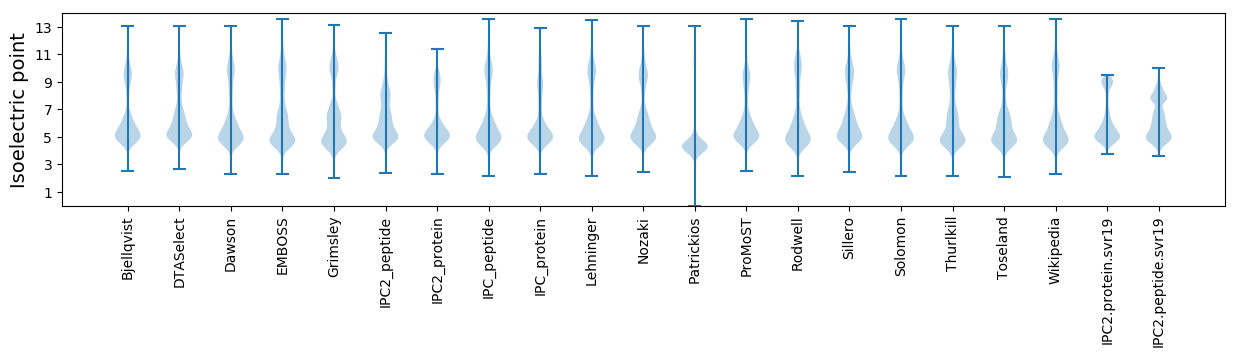
* You can choose from 21 different methods for calculating isoelectric point
Summary statistics related to proteome-wise predictions
Protein with the lowest isoelectric point:
>tr|A0A4R4ZM40|A0A4R4ZM40_9ACTN Carboxymuconolactone decarboxylase family protein OS=Kribbella antibiotica OX=190195 GN=E1263_18095 PE=4 SV=1
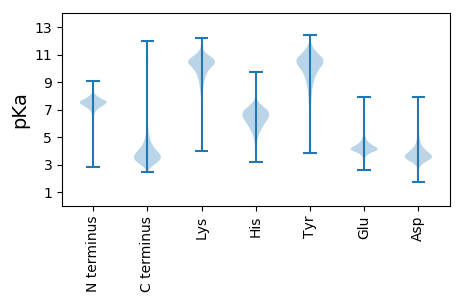
MM1 pKa = 6.92QVAVDD6 pKa = 3.9VPKK9 pKa = 10.78CVASGQCVQIAPEE22 pKa = 4.18VFDD25 pKa = 4.78QRR27 pKa = 11.84DD28 pKa = 3.54DD29 pKa = 3.95DD30 pKa = 4.65GMVVLLDD37 pKa = 3.89EE38 pKa = 5.11APPPAEE44 pKa = 4.17HH45 pKa = 7.6DD46 pKa = 4.26SVHH49 pKa = 6.08EE50 pKa = 4.14AALVCPAAAFLVTAA64 pKa = 5.24
MM1 pKa = 6.92QVAVDD6 pKa = 3.9VPKK9 pKa = 10.78CVASGQCVQIAPEE22 pKa = 4.18VFDD25 pKa = 4.78QRR27 pKa = 11.84DD28 pKa = 3.54DD29 pKa = 3.95DD30 pKa = 4.65GMVVLLDD37 pKa = 3.89EE38 pKa = 5.11APPPAEE44 pKa = 4.17HH45 pKa = 7.6DD46 pKa = 4.26SVHH49 pKa = 6.08EE50 pKa = 4.14AALVCPAAAFLVTAA64 pKa = 5.24
Molecular weight: 6.69 kDa
Isoelectric point according different methods:
Protein with the highest isoelectric point:
>tr|A0A4R4ZVB0|A0A4R4ZVB0_9ACTN DUF4303 domain-containing protein OS=Kribbella antibiotica OX=190195 GN=E1263_04455 PE=4 SV=1
MM1 pKa = 7.69SKK3 pKa = 9.0RR4 pKa = 11.84TFQPNNRR11 pKa = 11.84RR12 pKa = 11.84RR13 pKa = 11.84HH14 pKa = 5.34KK15 pKa = 10.47KK16 pKa = 8.84HH17 pKa = 5.5GFRR20 pKa = 11.84LRR22 pKa = 11.84MRR24 pKa = 11.84TRR26 pKa = 11.84AGRR29 pKa = 11.84AIIAARR35 pKa = 11.84RR36 pKa = 11.84NKK38 pKa = 9.34GRR40 pKa = 11.84QRR42 pKa = 11.84LAAA45 pKa = 4.56
MM1 pKa = 7.69SKK3 pKa = 9.0RR4 pKa = 11.84TFQPNNRR11 pKa = 11.84RR12 pKa = 11.84RR13 pKa = 11.84HH14 pKa = 5.34KK15 pKa = 10.47KK16 pKa = 8.84HH17 pKa = 5.5GFRR20 pKa = 11.84LRR22 pKa = 11.84MRR24 pKa = 11.84TRR26 pKa = 11.84AGRR29 pKa = 11.84AIIAARR35 pKa = 11.84RR36 pKa = 11.84NKK38 pKa = 9.34GRR40 pKa = 11.84QRR42 pKa = 11.84LAAA45 pKa = 4.56
Molecular weight: 5.43 kDa
Isoelectric point according different methods:
Peptides (in silico digests for buttom-up proteomics)
Below you can find in silico digests of the whole proteome with Trypsin, Chymotrypsin, Trypsin+LysC, LysN, ArgC proteases suitable for different mass spec machines.| Try ESI |
 |
|---|
| ChTry ESI |
|
|---|
| ArgC ESI |
|
|---|
| LysN ESI |
|
|---|
| TryLysC ESI |
|
|---|
| Try MALDI |
|
|---|
| ChTry MALDI |
|
|---|
| ArgC MALDI |
|
|---|
| LysN MALDI |
|
|---|
| TryLysC MALDI |
|
|---|
| Try LTQ |
|
|---|
| ChTry LTQ |
|
|---|
| ArgC LTQ |
|
|---|
| LysN LTQ |
|
|---|
| TryLysC LTQ |
|
|---|
| Try MSlow |
|
|---|
| ChTry MSlow |
|
|---|
| ArgC MSlow |
|
|---|
| LysN MSlow |
|
|---|
| TryLysC MSlow |
|
|---|
| Try MShigh |
|
|---|
| ChTry MShigh |
|
|---|
| ArgC MShigh |
|
|---|
| LysN MShigh |
|
|---|
| TryLysC MShigh |
|
|---|
General Statistics
Number of major isoforms |
Number of additional isoforms |
Number of all proteins |
Number of amino acids |
Min. Seq. Length |
Max. Seq. Length |
Avg. Seq. Length |
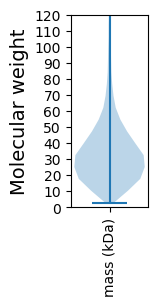
Avg. Mol. Weight |
|---|---|---|---|---|---|---|---|
0 |
2784158 |
27 |
6789 |
335.8 |
36.11 |
Amino acid frequency
Ala |
Cys |
Asp |
Glu |
Phe |
Gly |
His |
Ile |
Lys |
Leu |
|---|---|---|---|---|---|---|---|---|---|
12.631 ± 0.035 | 0.696 ± 0.008 |
6.015 ± 0.023 | 5.271 ± 0.026 |
2.98 ± 0.016 | 8.864 ± 0.027 |
2.061 ± 0.013 | 4.021 ± 0.02 |
2.594 ± 0.02 | 10.34 ± 0.035 |
Met |
Asn |
Gln |
Pro |
Arg |
Ser |
Thr |
Val |
Trp |
Tyr |
|---|---|---|---|---|---|---|---|---|---|
1.691 ± 0.01 | 2.352 ± 0.017 |
5.682 ± 0.021 | 3.253 ± 0.014 |
6.939 ± 0.028 | 5.549 ± 0.019 |
6.498 ± 0.03 | 8.586 ± 0.024 |
1.648 ± 0.011 | 2.326 ± 0.015 |
Most of the basic statistics you can see at this page can be downloaded from this CSV file
See this proteome in:

Proteome-pI is available under Creative Commons Attribution-NoDerivs license, for more details see here
| Reference: Kozlowski LP. Proteome-pI 2.0: Proteome Isoelectric Point Database Update. Nucleic Acids Res. 2021, doi: 10.1093/nar/gkab944 | Contact: Lukasz P. Kozlowski |