Escherichia phage MS2 (Bacteriophage MS2)
Taxonomy: Viruses; Riboviria; Orthornavirae; Lenarviricota; Allassoviricetes; Levivirales; Leviviridae; Levivirus
Average proteome isoelectric point is 8.42
Get precalculated fractions of proteins
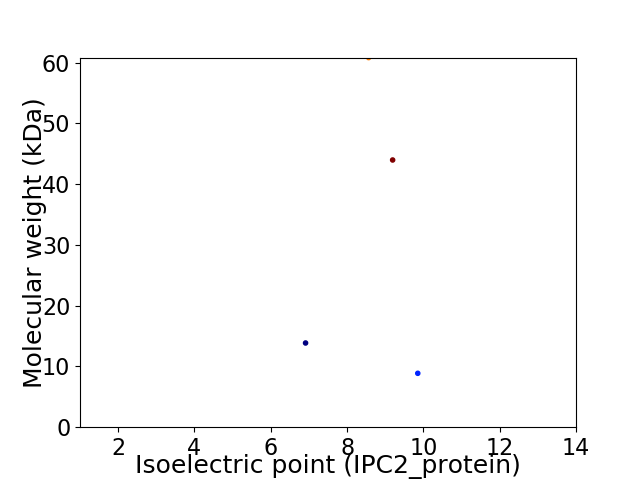
Virtual 2D-PAGE plot for 4 proteins (isoelectric point calculated using IPC2_protein)
Get csv file with sequences according to given criteria:
* You can choose from 21 different methods for calculating isoelectric point
Summary statistics related to proteome-wise predictions
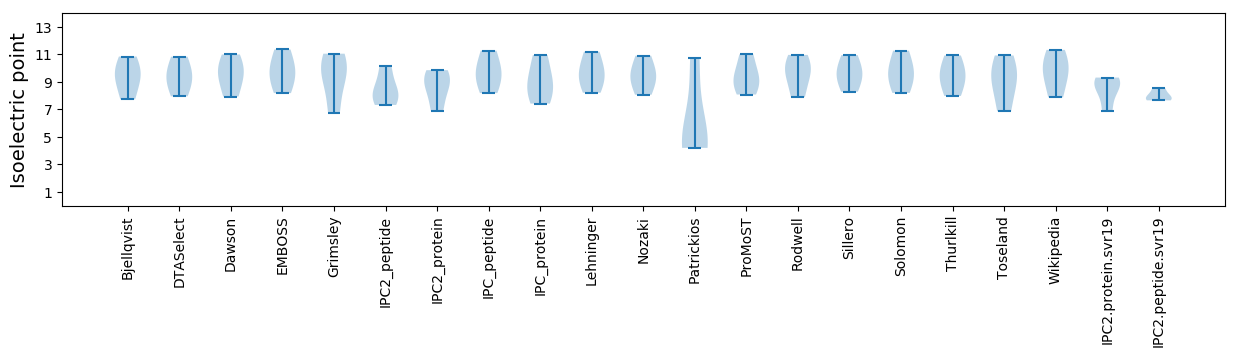
Protein with the lowest isoelectric point:
>sp|P03612|CAPSD_BPMS2 Capsid protein OS=Escherichia phage MS2 OX=329852 PE=1 SV=2
MM1 pKa = 7.8ASNFTQFVLVDD12 pKa = 3.32NGGTGDD18 pKa = 3.67VTVAPSNFANGVAEE32 pKa = 4.71WISSNSRR39 pKa = 11.84SQAYY43 pKa = 9.18KK44 pKa = 7.66VTCSVRR50 pKa = 11.84QSSAQNRR57 pKa = 11.84KK58 pKa = 6.94YY59 pKa = 8.88TIKK62 pKa = 10.9VEE64 pKa = 4.25VPKK67 pKa = 10.97VATQTVGGVEE77 pKa = 4.21LPVAAWRR84 pKa = 11.84SYY86 pKa = 11.56LNMEE90 pKa = 3.9LTIPIFATNSDD101 pKa = 3.79CEE103 pKa = 4.82LIVKK107 pKa = 10.01AMQGLLKK114 pKa = 10.45DD115 pKa = 4.02GNPIPSAIAANSGIYY130 pKa = 9.86
MM1 pKa = 7.8ASNFTQFVLVDD12 pKa = 3.32NGGTGDD18 pKa = 3.67VTVAPSNFANGVAEE32 pKa = 4.71WISSNSRR39 pKa = 11.84SQAYY43 pKa = 9.18KK44 pKa = 7.66VTCSVRR50 pKa = 11.84QSSAQNRR57 pKa = 11.84KK58 pKa = 6.94YY59 pKa = 8.88TIKK62 pKa = 10.9VEE64 pKa = 4.25VPKK67 pKa = 10.97VATQTVGGVEE77 pKa = 4.21LPVAAWRR84 pKa = 11.84SYY86 pKa = 11.56LNMEE90 pKa = 3.9LTIPIFATNSDD101 pKa = 3.79CEE103 pKa = 4.82LIVKK107 pKa = 10.01AMQGLLKK114 pKa = 10.45DD115 pKa = 4.02GNPIPSAIAANSGIYY130 pKa = 9.86
Molecular weight: 13.86 kDa
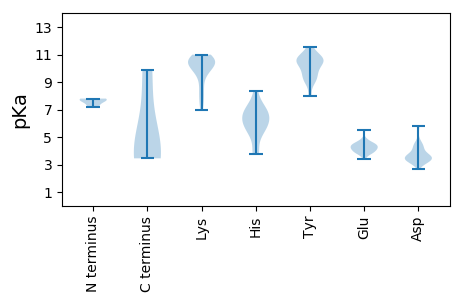
Isoelectric point according different methods:
Protein with the highest isoelectric point:
>sp|P03610|MATA_BPMS2 Maturation protein A OS=Escherichia phage MS2 OX=329852 GN=A PE=1 SV=1
MM1 pKa = 7.21EE2 pKa = 4.57TRR4 pKa = 11.84FPQQSQQTPASTNRR18 pKa = 11.84RR19 pKa = 11.84RR20 pKa = 11.84PFKK23 pKa = 10.96HH24 pKa = 6.25EE25 pKa = 4.89DD26 pKa = 3.55YY27 pKa = 10.52PCRR30 pKa = 11.84RR31 pKa = 11.84QQRR34 pKa = 11.84SSTLYY39 pKa = 10.25VLIFLAIFLSKK50 pKa = 9.68FTNQLLLSLLEE61 pKa = 3.96AVIRR65 pKa = 11.84TVTTLQQLLTT75 pKa = 4.01
MM1 pKa = 7.21EE2 pKa = 4.57TRR4 pKa = 11.84FPQQSQQTPASTNRR18 pKa = 11.84RR19 pKa = 11.84RR20 pKa = 11.84PFKK23 pKa = 10.96HH24 pKa = 6.25EE25 pKa = 4.89DD26 pKa = 3.55YY27 pKa = 10.52PCRR30 pKa = 11.84RR31 pKa = 11.84QQRR34 pKa = 11.84SSTLYY39 pKa = 10.25VLIFLAIFLSKK50 pKa = 9.68FTNQLLLSLLEE61 pKa = 3.96AVIRR65 pKa = 11.84TVTTLQQLLTT75 pKa = 4.01
Molecular weight: 8.87 kDa
Isoelectric point according different methods:
Peptides (in silico digests for buttom-up proteomics)
Below you can find in silico digests of the whole proteome with Trypsin, Chymotrypsin, Trypsin+LysC, LysN, ArgC proteases suitable for different mass spec machines.| Try ESI |
 |
|---|
| ChTry ESI |
|
|---|
| ArgC ESI |
|
|---|
| LysN ESI |
|
|---|
| TryLysC ESI |
|
|---|
| Try MALDI |
|
|---|
| ChTry MALDI |
|
|---|
| ArgC MALDI |
|
|---|
| LysN MALDI |
|
|---|
| TryLysC MALDI |
|
|---|
| Try LTQ |
|
|---|
| ChTry LTQ |
|
|---|
| ArgC LTQ |
|
|---|
| LysN LTQ |
|
|---|
| TryLysC LTQ |
|
|---|
| Try MSlow |
|
|---|
| ChTry MSlow |
|
|---|
| ArgC MSlow |
|
|---|
| LysN MSlow |
|
|---|
| TryLysC MSlow |
|
|---|
| Try MShigh |
|
|---|
| ChTry MShigh |
|
|---|
| ArgC MShigh |
|
|---|
| LysN MShigh |
|
|---|
| TryLysC MShigh |
|
|---|
General Statistics
Number of major isoforms |
Number of additional isoforms |
Number of all proteins |
Number of amino acids |
Min. Seq. Length |
Max. Seq. Length |
Avg. Seq. Length |
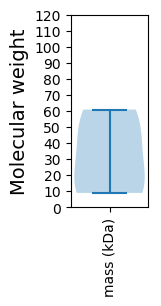
Avg. Mol. Weight |
|---|---|---|---|---|---|---|---|
0 |
1143 |
75 |
545 |
285.8 |
31.89 |
Amino acid frequency
Ala |
Cys |
Asp |
Glu |
Phe |
Gly |
His |
Ile |
Lys |
Leu |
|---|---|---|---|---|---|---|---|---|---|
8.136 ± 0.74 | 1.137 ± 0.152 |
4.462 ± 0.983 | 4.112 ± 0.087 |
4.637 ± 0.452 | 7.087 ± 1.021 |
1.4 ± 0.3 | 5.162 ± 0.527 |
4.112 ± 0.348 | 9.186 ± 0.988 |
Met |
Asn |
Gln |
Pro |
Arg |
Ser |
Thr |
Val |
Trp |
Tyr |
|---|---|---|---|---|---|---|---|---|---|
1.925 ± 0.107 | 4.112 ± 0.675 |
4.724 ± 0.187 | 4.199 ± 1.229 |
7.262 ± 0.751 | 9.011 ± 0.217 |
6.649 ± 0.832 | 6.912 ± 0.862 |
2.012 ± 0.459 | 3.762 ± 0.205 |
Most of the basic statistics you can see at this page can be downloaded from this CSV file
See this proteome in:

Proteome-pI is available under Creative Commons Attribution-NoDerivs license, for more details see here
| Reference: Kozlowski LP. Proteome-pI 2.0: Proteome Isoelectric Point Database Update. Nucleic Acids Res. 2021, doi: 10.1093/nar/gkab944 | Contact: Lukasz P. Kozlowski |