Listeria phage B054
Taxonomy: Viruses; Duplodnaviria; Heunggongvirae; Uroviricota; Caudoviricetes; Caudovirales; Myoviridae; unclassified Myoviridae
Average proteome isoelectric point is 6.51
Get precalculated fractions of proteins
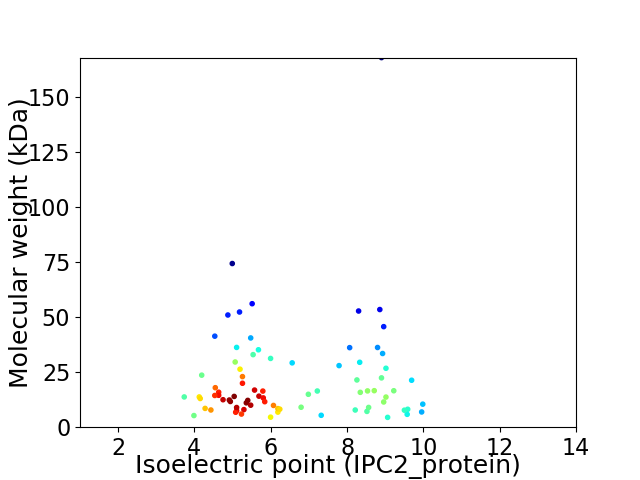
Virtual 2D-PAGE plot for 80 proteins (isoelectric point calculated using IPC2_protein)
Get csv file with sequences according to given criteria:
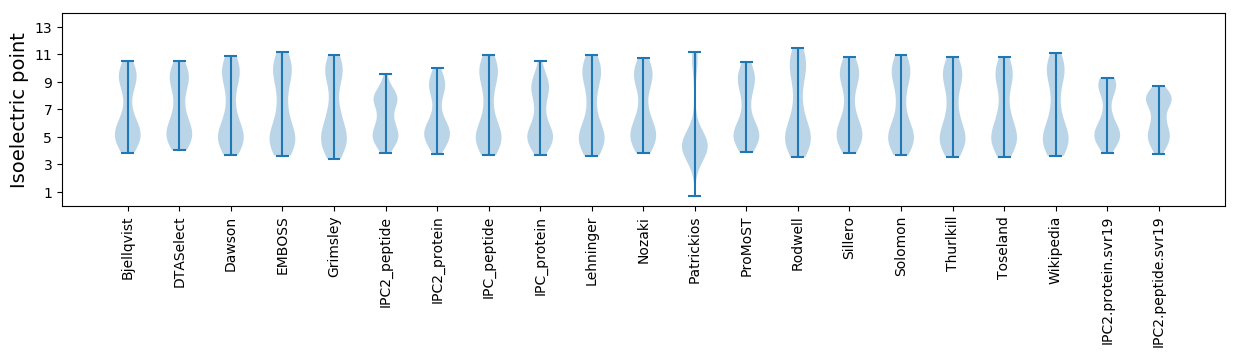
* You can choose from 21 different methods for calculating isoelectric point
Summary statistics related to proteome-wise predictions
Protein with the lowest isoelectric point:
>tr|A8ATM6|A8ATM6_9CAUD Gp68 OS=Listeria phage B054 OX=330397 PE=4 SV=1
MM1 pKa = 7.71SEE3 pKa = 3.97TTEE6 pKa = 4.33MILEE10 pKa = 5.05GILCRR15 pKa = 11.84NCGVFIDD22 pKa = 4.87DD23 pKa = 4.44VNPGYY28 pKa = 9.9PRR30 pKa = 11.84TCEE33 pKa = 3.84DD34 pKa = 4.91CEE36 pKa = 4.94DD37 pKa = 4.15CEE39 pKa = 4.43EE40 pKa = 4.84DD41 pKa = 4.03NNEE44 pKa = 3.94KK45 pKa = 10.6RR46 pKa = 3.83
MM1 pKa = 7.71SEE3 pKa = 3.97TTEE6 pKa = 4.33MILEE10 pKa = 5.05GILCRR15 pKa = 11.84NCGVFIDD22 pKa = 4.87DD23 pKa = 4.44VNPGYY28 pKa = 9.9PRR30 pKa = 11.84TCEE33 pKa = 3.84DD34 pKa = 4.91CEE36 pKa = 4.94DD37 pKa = 4.15CEE39 pKa = 4.43EE40 pKa = 4.84DD41 pKa = 4.03NNEE44 pKa = 3.94KK45 pKa = 10.6RR46 pKa = 3.83
Molecular weight: 5.29 kDa
Isoelectric point according different methods:
Protein with the highest isoelectric point:
>tr|A8ATN2|A8ATN2_9CAUD Gp74 OS=Listeria phage B054 OX=330397 PE=4 SV=1
MM1 pKa = 7.61KK2 pKa = 9.77FLKK5 pKa = 10.05MSEE8 pKa = 3.89FRR10 pKa = 11.84LLSTRR15 pKa = 11.84IFNKK19 pKa = 9.26PAFYY23 pKa = 10.29RR24 pKa = 11.84IKK26 pKa = 10.99LNFLLTFYY34 pKa = 11.24RR35 pKa = 11.84LFTGQKK41 pKa = 7.29TRR43 pKa = 11.84NSVVRR48 pKa = 11.84CYY50 pKa = 10.66CQEE53 pKa = 3.81NKK55 pKa = 10.22KK56 pKa = 10.66
MM1 pKa = 7.61KK2 pKa = 9.77FLKK5 pKa = 10.05MSEE8 pKa = 3.89FRR10 pKa = 11.84LLSTRR15 pKa = 11.84IFNKK19 pKa = 9.26PAFYY23 pKa = 10.29RR24 pKa = 11.84IKK26 pKa = 10.99LNFLLTFYY34 pKa = 11.24RR35 pKa = 11.84LFTGQKK41 pKa = 7.29TRR43 pKa = 11.84NSVVRR48 pKa = 11.84CYY50 pKa = 10.66CQEE53 pKa = 3.81NKK55 pKa = 10.22KK56 pKa = 10.66
Molecular weight: 6.92 kDa
Isoelectric point according different methods:
Peptides (in silico digests for buttom-up proteomics)
Below you can find in silico digests of the whole proteome with Trypsin, Chymotrypsin, Trypsin+LysC, LysN, ArgC proteases suitable for different mass spec machines.| Try ESI |
 |
|---|
| ChTry ESI |
|
|---|
| ArgC ESI |
|
|---|
| LysN ESI |
|
|---|
| TryLysC ESI |
|
|---|
| Try MALDI |
|
|---|
| ChTry MALDI |
|
|---|
| ArgC MALDI |
|
|---|
| LysN MALDI |
|
|---|
| TryLysC MALDI |
|
|---|
| Try LTQ |
|
|---|
| ChTry LTQ |
|
|---|
| ArgC LTQ |
|
|---|
| LysN LTQ |
|
|---|
| TryLysC LTQ |
|
|---|
| Try MSlow |
|
|---|
| ChTry MSlow |
|
|---|
| ArgC MSlow |
|
|---|
| LysN MSlow |
|
|---|
| TryLysC MSlow |
|
|---|
| Try MShigh |
|
|---|
| ChTry MShigh |
|
|---|
| ArgC MShigh |
|
|---|
| LysN MShigh |
|
|---|
| TryLysC MShigh |
|
|---|
General Statistics
Number of major isoforms |
Number of additional isoforms |
Number of all proteins |
Number of amino acids |
Min. Seq. Length |
Max. Seq. Length |
Avg. Seq. Length |
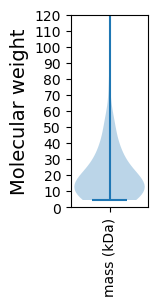
Avg. Mol. Weight |
|---|---|---|---|---|---|---|---|
0 |
15352 |
38 |
1571 |
191.9 |
21.72 |
Amino acid frequency
Ala |
Cys |
Asp |
Glu |
Phe |
Gly |
His |
Ile |
Lys |
Leu |
|---|---|---|---|---|---|---|---|---|---|
7.256 ± 0.457 | 0.69 ± 0.102 |
5.719 ± 0.269 | 8.253 ± 0.317 |
4.019 ± 0.168 | 5.791 ± 0.513 |
1.518 ± 0.14 | 7.523 ± 0.278 |
9.419 ± 0.383 | 8.084 ± 0.381 |
Met |
Asn |
Gln |
Pro |
Arg |
Ser |
Thr |
Val |
Trp |
Tyr |
|---|---|---|---|---|---|---|---|---|---|
2.365 ± 0.122 | 6.162 ± 0.225 |
2.716 ± 0.156 | 3.465 ± 0.182 |
4.325 ± 0.271 | 6.501 ± 0.289 |
5.713 ± 0.21 | 5.934 ± 0.233 |
1.088 ± 0.097 | 3.459 ± 0.278 |
Most of the basic statistics you can see at this page can be downloaded from this CSV file
See this proteome in:

Proteome-pI is available under Creative Commons Attribution-NoDerivs license, for more details see here
| Reference: Kozlowski LP. Proteome-pI 2.0: Proteome Isoelectric Point Database Update. Nucleic Acids Res. 2021, doi: 10.1093/nar/gkab944 | Contact: Lukasz P. Kozlowski |