Macrophomina phaseolina (strain MS6) (Charcoal rot fungus)
Taxonomy: cellular organisms; Eukaryota; Opisthokonta; Fungi; Dikarya; Ascomycota; saccharomyceta; Pezizomycotina; leotiomyceta; dothideomyceta; Dothideomycetes; Dothideomycetes incertae sedis; Botryosphaeriales; Botryosphaeriaceae; Macrophomina; Macrophomina phaseolina
Average proteome isoelectric point is 6.64
Get precalculated fractions of proteins
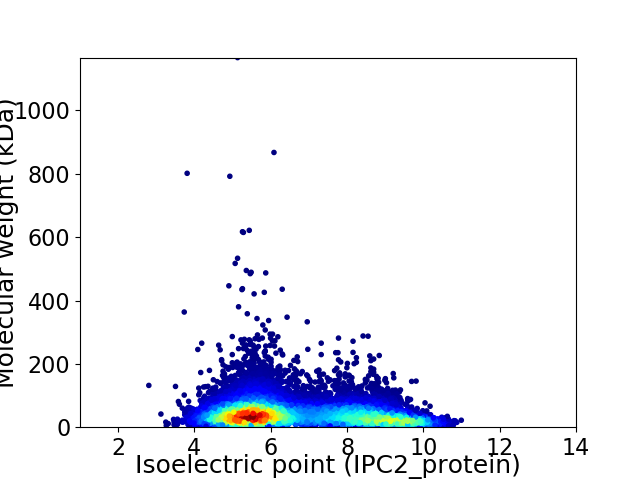
Virtual 2D-PAGE plot for 13803 proteins (isoelectric point calculated using IPC2_protein)
Get csv file with sequences according to given criteria:
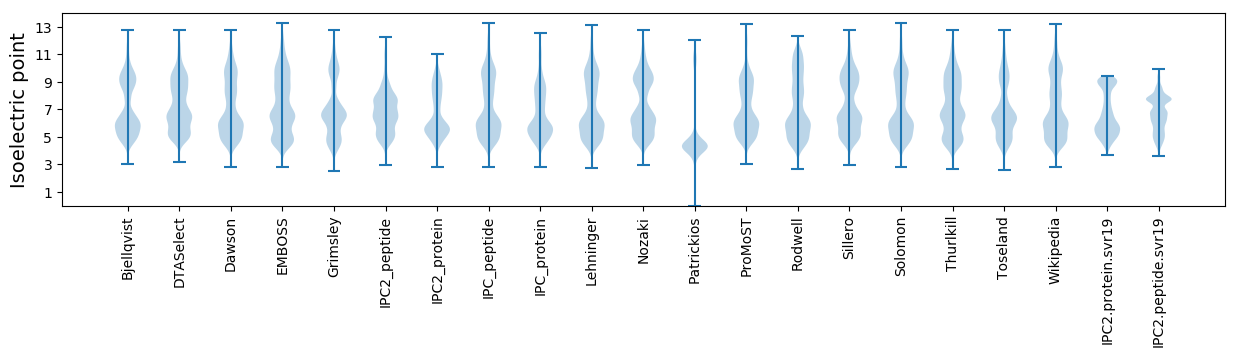
* You can choose from 21 different methods for calculating isoelectric point
Summary statistics related to proteome-wise predictions
Protein with the lowest isoelectric point:
>tr|K2S100|K2S100_MACPH Ribonuclease H-like protein OS=Macrophomina phaseolina (strain MS6) OX=1126212 GN=MPH_04142 PE=4 SV=1
MM1 pKa = 7.67LKK3 pKa = 10.05QLTLVALATTAFAQTQDD20 pKa = 3.64LNATLTSTPEE30 pKa = 3.88LSNLTTYY37 pKa = 11.26LGMFPDD43 pKa = 3.88ILTTLSGVSNITILAPNNDD62 pKa = 3.54AFGKK66 pKa = 10.47LLASPIGSQLASNPALIQSVLTYY89 pKa = 10.35HH90 pKa = 6.25VLNGTYY96 pKa = 9.64TSNQITDD103 pKa = 3.81DD104 pKa = 3.67VAFIPTLLTDD114 pKa = 3.9PAYY117 pKa = 10.76ANVTGGQRR125 pKa = 11.84VGVEE129 pKa = 4.14TEE131 pKa = 3.98DD132 pKa = 4.19DD133 pKa = 3.51NVIIYY138 pKa = 10.58SGLLQNSTVTQADD151 pKa = 3.63VQFTGGVVHH160 pKa = 7.57IIDD163 pKa = 3.88TVLTLPANASTTAIAANLTALAGALTTANLVSAVDD198 pKa = 3.56TARR201 pKa = 11.84DD202 pKa = 3.39ITVFAPTNAAFEE214 pKa = 5.08AIGSVLANATTQQLTDD230 pKa = 3.2VLTYY234 pKa = 10.36HH235 pKa = 6.03VVNGTVAYY243 pKa = 8.01STTLQPGEE251 pKa = 4.08QTVTTLNGGQLTIRR265 pKa = 11.84VQDD268 pKa = 4.27DD269 pKa = 3.31GDD271 pKa = 3.96VFVNGARR278 pKa = 11.84VVLTDD283 pKa = 3.12VLIANGVVHH292 pKa = 7.15VIDD295 pKa = 4.69NVLNPANATAAPPTGDD311 pKa = 3.63NADD314 pKa = 3.81DD315 pKa = 3.74TGSVQFGGASSGNVPFTAGIPSPTGTIGGGNLSSGNATPTAGTQPSSGAMANTVISGGLMGIAIGLGGVVLGLL388 pKa = 3.79
MM1 pKa = 7.67LKK3 pKa = 10.05QLTLVALATTAFAQTQDD20 pKa = 3.64LNATLTSTPEE30 pKa = 3.88LSNLTTYY37 pKa = 11.26LGMFPDD43 pKa = 3.88ILTTLSGVSNITILAPNNDD62 pKa = 3.54AFGKK66 pKa = 10.47LLASPIGSQLASNPALIQSVLTYY89 pKa = 10.35HH90 pKa = 6.25VLNGTYY96 pKa = 9.64TSNQITDD103 pKa = 3.81DD104 pKa = 3.67VAFIPTLLTDD114 pKa = 3.9PAYY117 pKa = 10.76ANVTGGQRR125 pKa = 11.84VGVEE129 pKa = 4.14TEE131 pKa = 3.98DD132 pKa = 4.19DD133 pKa = 3.51NVIIYY138 pKa = 10.58SGLLQNSTVTQADD151 pKa = 3.63VQFTGGVVHH160 pKa = 7.57IIDD163 pKa = 3.88TVLTLPANASTTAIAANLTALAGALTTANLVSAVDD198 pKa = 3.56TARR201 pKa = 11.84DD202 pKa = 3.39ITVFAPTNAAFEE214 pKa = 5.08AIGSVLANATTQQLTDD230 pKa = 3.2VLTYY234 pKa = 10.36HH235 pKa = 6.03VVNGTVAYY243 pKa = 8.01STTLQPGEE251 pKa = 4.08QTVTTLNGGQLTIRR265 pKa = 11.84VQDD268 pKa = 4.27DD269 pKa = 3.31GDD271 pKa = 3.96VFVNGARR278 pKa = 11.84VVLTDD283 pKa = 3.12VLIANGVVHH292 pKa = 7.15VIDD295 pKa = 4.69NVLNPANATAAPPTGDD311 pKa = 3.63NADD314 pKa = 3.81DD315 pKa = 3.74TGSVQFGGASSGNVPFTAGIPSPTGTIGGGNLSSGNATPTAGTQPSSGAMANTVISGGLMGIAIGLGGVVLGLL388 pKa = 3.79
Molecular weight: 39.11 kDa
Isoelectric point according different methods:
Protein with the highest isoelectric point:
>tr|K2SE33|K2SE33_MACPH WW/Rsp5/WWP OS=Macrophomina phaseolina (strain MS6) OX=1126212 GN=MPH_02029 PE=4 SV=1
MM1 pKa = 7.78LSTLAPRR8 pKa = 11.84PTLSSATPTSRR19 pKa = 11.84TRR21 pKa = 11.84MTALLSTPARR31 pKa = 11.84TLPSPAAPALVATVSPSAPLVAAPTTLSRR60 pKa = 11.84ASRR63 pKa = 11.84SRR65 pKa = 11.84TLPSRR70 pKa = 11.84TPTTVSASRR79 pKa = 11.84PSTAPPALSPVSPTAASPSRR99 pKa = 11.84TLPSMVSSLSRR110 pKa = 11.84TTRR113 pKa = 11.84TAPPLASLPAAFRR126 pKa = 11.84SPTSPSPTSRR136 pKa = 11.84APSPPAVPMSTSSALLVPAPTGSGPVSRR164 pKa = 11.84SLVARR169 pKa = 11.84RR170 pKa = 11.84APSAPAFPAALALLAKK186 pKa = 10.12CLVPVARR193 pKa = 11.84RR194 pKa = 11.84VAALPKK200 pKa = 9.76RR201 pKa = 11.84VHH203 pKa = 6.32FSSKK207 pKa = 10.23VKK209 pKa = 10.69GLTTEE214 pKa = 4.41GFLGSS219 pKa = 3.71
MM1 pKa = 7.78LSTLAPRR8 pKa = 11.84PTLSSATPTSRR19 pKa = 11.84TRR21 pKa = 11.84MTALLSTPARR31 pKa = 11.84TLPSPAAPALVATVSPSAPLVAAPTTLSRR60 pKa = 11.84ASRR63 pKa = 11.84SRR65 pKa = 11.84TLPSRR70 pKa = 11.84TPTTVSASRR79 pKa = 11.84PSTAPPALSPVSPTAASPSRR99 pKa = 11.84TLPSMVSSLSRR110 pKa = 11.84TTRR113 pKa = 11.84TAPPLASLPAAFRR126 pKa = 11.84SPTSPSPTSRR136 pKa = 11.84APSPPAVPMSTSSALLVPAPTGSGPVSRR164 pKa = 11.84SLVARR169 pKa = 11.84RR170 pKa = 11.84APSAPAFPAALALLAKK186 pKa = 10.12CLVPVARR193 pKa = 11.84RR194 pKa = 11.84VAALPKK200 pKa = 9.76RR201 pKa = 11.84VHH203 pKa = 6.32FSSKK207 pKa = 10.23VKK209 pKa = 10.69GLTTEE214 pKa = 4.41GFLGSS219 pKa = 3.71
Molecular weight: 22.02 kDa
Isoelectric point according different methods:
Peptides (in silico digests for buttom-up proteomics)
Below you can find in silico digests of the whole proteome with Trypsin, Chymotrypsin, Trypsin+LysC, LysN, ArgC proteases suitable for different mass spec machines.| Try ESI |
 |
|---|
| ChTry ESI |
|
|---|
| ArgC ESI |
|
|---|
| LysN ESI |
|
|---|
| TryLysC ESI |
|
|---|
| Try MALDI |
|
|---|
| ChTry MALDI |
|
|---|
| ArgC MALDI |
|
|---|
| LysN MALDI |
|
|---|
| TryLysC MALDI |
|
|---|
| Try LTQ |
|
|---|
| ChTry LTQ |
|
|---|
| ArgC LTQ |
|
|---|
| LysN LTQ |
|
|---|
| TryLysC LTQ |
|
|---|
| Try MSlow |
|
|---|
| ChTry MSlow |
|
|---|
| ArgC MSlow |
|
|---|
| LysN MSlow |
|
|---|
| TryLysC MSlow |
|
|---|
| Try MShigh |
|
|---|
| ChTry MShigh |
|
|---|
| ArgC MShigh |
|
|---|
| LysN MShigh |
|
|---|
| TryLysC MShigh |
|
|---|
General Statistics
Number of major isoforms |
Number of additional isoforms |
Number of all proteins |
Number of amino acids |
Min. Seq. Length |
Max. Seq. Length |
Avg. Seq. Length |
Avg. Mol. Weight |
|---|---|---|---|---|---|---|---|
0 |
5914650 |
8 |
10745 |
428.5 |
47.3 |
Amino acid frequency
Ala |
Cys |
Asp |
Glu |
Phe |
Gly |
His |
Ile |
Lys |
Leu |
|---|---|---|---|---|---|---|---|---|---|
9.403 ± 0.022 | 1.271 ± 0.009 |
5.578 ± 0.016 | 6.181 ± 0.023 |
3.727 ± 0.013 | 7.016 ± 0.022 |
2.414 ± 0.01 | 4.57 ± 0.014 |
4.68 ± 0.02 | 8.807 ± 0.025 |
Met |
Asn |
Gln |
Pro |
Arg |
Ser |
Thr |
Val |
Trp |
Tyr |
|---|---|---|---|---|---|---|---|---|---|
2.099 ± 0.008 | 3.523 ± 0.013 |
6.141 ± 0.025 | 3.937 ± 0.018 |
6.357 ± 0.021 | 8.052 ± 0.026 |
5.842 ± 0.026 | 6.148 ± 0.018 |
1.513 ± 0.008 | 2.741 ± 0.012 |
Most of the basic statistics you can see at this page can be downloaded from this CSV file
See this proteome in:

Proteome-pI is available under Creative Commons Attribution-NoDerivs license, for more details see here
| Reference: Kozlowski LP. Proteome-pI 2.0: Proteome Isoelectric Point Database Update. Nucleic Acids Res. 2021, doi: 10.1093/nar/gkab944 | Contact: Lukasz P. Kozlowski |