Caulobacter phage Ccr34
Taxonomy: Viruses; Duplodnaviria; Heunggongvirae; Uroviricota; Caudoviricetes; Caudovirales; Siphoviridae; Dolichocephalovirinae; Shapirovirus; unclassified Shapirovirus
Average proteome isoelectric point is 6.48
Get precalculated fractions of proteins
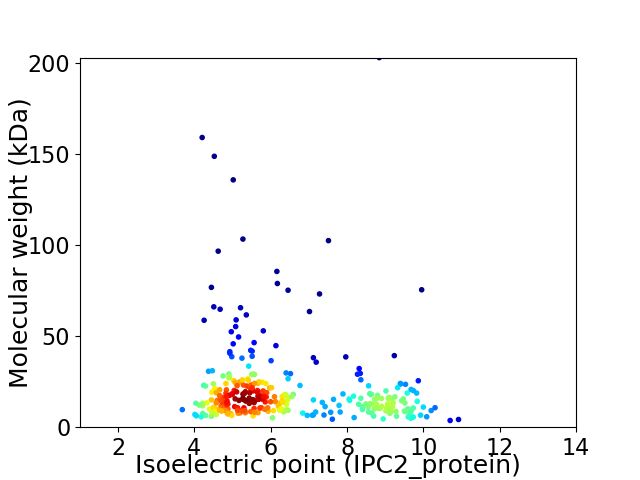
Virtual 2D-PAGE plot for 321 proteins (isoelectric point calculated using IPC2_protein)
Get csv file with sequences according to given criteria:
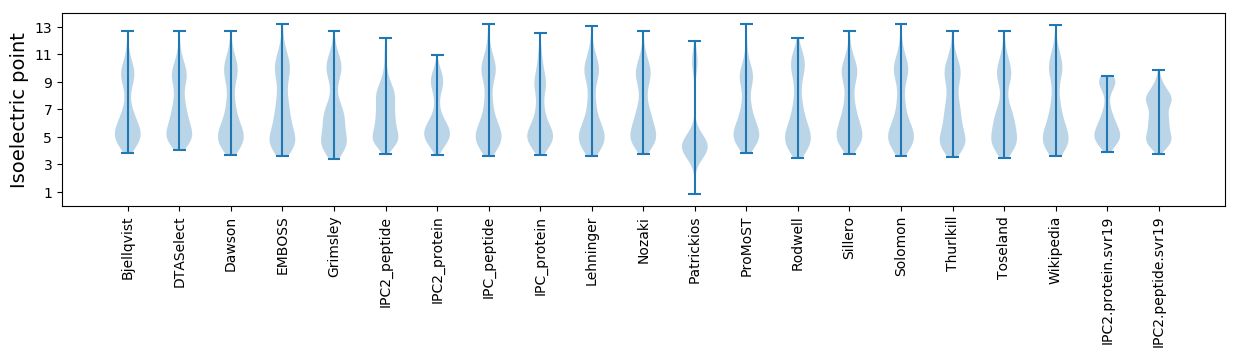
* You can choose from 21 different methods for calculating isoelectric point
Summary statistics related to proteome-wise predictions
Protein with the lowest isoelectric point:
>tr|A0A1V0EEQ0|A0A1V0EEQ0_9CAUD Integrase OS=Caulobacter phage Ccr34 OX=1959739 GN=Ccr34_gp148 PE=3 SV=1
MM1 pKa = 7.89RR2 pKa = 11.84EE3 pKa = 3.81GFMLEE8 pKa = 4.36GYY10 pKa = 9.94GGLKK14 pKa = 9.79IGPGGGADD22 pKa = 3.82PYY24 pKa = 8.94TTLGDD29 pKa = 4.04GGSEE33 pKa = 3.97GCIPVKK39 pKa = 10.77DD40 pKa = 5.34DD41 pKa = 3.22IAPDD45 pKa = 3.55GGTEE49 pKa = 3.9IISPHH54 pKa = 6.43GYY56 pKa = 9.87GG57 pKa = 4.0
MM1 pKa = 7.89RR2 pKa = 11.84EE3 pKa = 3.81GFMLEE8 pKa = 4.36GYY10 pKa = 9.94GGLKK14 pKa = 9.79IGPGGGADD22 pKa = 3.82PYY24 pKa = 8.94TTLGDD29 pKa = 4.04GGSEE33 pKa = 3.97GCIPVKK39 pKa = 10.77DD40 pKa = 5.34DD41 pKa = 3.22IAPDD45 pKa = 3.55GGTEE49 pKa = 3.9IISPHH54 pKa = 6.43GYY56 pKa = 9.87GG57 pKa = 4.0
Molecular weight: 5.68 kDa
Isoelectric point according different methods:
Protein with the highest isoelectric point:
>tr|A0A1V0EF72|A0A1V0EF72_9CAUD Uncharacterized protein OS=Caulobacter phage Ccr34 OX=1959739 GN=Ccr34_gp318 PE=4 SV=1
MM1 pKa = 7.83RR2 pKa = 11.84PRR4 pKa = 11.84MFAFLRR10 pKa = 11.84RR11 pKa = 11.84LSLAAVHH18 pKa = 5.93GVLWAILLAMLALGGPRR35 pKa = 11.84RR36 pKa = 11.84APP38 pKa = 3.25
MM1 pKa = 7.83RR2 pKa = 11.84PRR4 pKa = 11.84MFAFLRR10 pKa = 11.84RR11 pKa = 11.84LSLAAVHH18 pKa = 5.93GVLWAILLAMLALGGPRR35 pKa = 11.84RR36 pKa = 11.84APP38 pKa = 3.25
Molecular weight: 4.23 kDa
Isoelectric point according different methods:
Peptides (in silico digests for buttom-up proteomics)
Below you can find in silico digests of the whole proteome with Trypsin, Chymotrypsin, Trypsin+LysC, LysN, ArgC proteases suitable for different mass spec machines.| Try ESI |
 |
|---|
| ChTry ESI |
|
|---|
| ArgC ESI |
|
|---|
| LysN ESI |
|
|---|
| TryLysC ESI |
|
|---|
| Try MALDI |
|
|---|
| ChTry MALDI |
|
|---|
| ArgC MALDI |
|
|---|
| LysN MALDI |
|
|---|
| TryLysC MALDI |
|
|---|
| Try LTQ |
|
|---|
| ChTry LTQ |
|
|---|
| ArgC LTQ |
|
|---|
| LysN LTQ |
|
|---|
| TryLysC LTQ |
|
|---|
| Try MSlow |
|
|---|
| ChTry MSlow |
|
|---|
| ArgC MSlow |
|
|---|
| LysN MSlow |
|
|---|
| TryLysC MSlow |
|
|---|
| Try MShigh |
|
|---|
| ChTry MShigh |
|
|---|
| ArgC MShigh |
|
|---|
| LysN MShigh |
|
|---|
| TryLysC MShigh |
|
|---|
General Statistics
Number of major isoforms |
Number of additional isoforms |
Number of all proteins |
Number of amino acids |
Min. Seq. Length |
Max. Seq. Length |
Avg. Seq. Length |
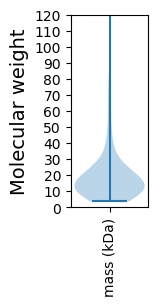
Avg. Mol. Weight |
|---|---|---|---|---|---|---|---|
0 |
62090 |
34 |
1964 |
193.4 |
21.29 |
Amino acid frequency
Ala |
Cys |
Asp |
Glu |
Phe |
Gly |
His |
Ile |
Lys |
Leu |
|---|---|---|---|---|---|---|---|---|---|
11.735 ± 0.198 | 0.897 ± 0.064 |
6.526 ± 0.159 | 6.263 ± 0.201 |
3.658 ± 0.097 | 8.158 ± 0.36 |
2.155 ± 0.094 | 4.622 ± 0.116 |
4.444 ± 0.171 | 8.278 ± 0.157 |
Met |
Asn |
Gln |
Pro |
Arg |
Ser |
Thr |
Val |
Trp |
Tyr |
|---|---|---|---|---|---|---|---|---|---|
2.264 ± 0.085 | 2.912 ± 0.102 |
5.312 ± 0.147 | 3.181 ± 0.103 |
6.982 ± 0.203 | 4.961 ± 0.172 |
6.009 ± 0.233 | 6.896 ± 0.125 |
1.727 ± 0.075 | 3.021 ± 0.088 |
Most of the basic statistics you can see at this page can be downloaded from this CSV file
See this proteome in:

Proteome-pI is available under Creative Commons Attribution-NoDerivs license, for more details see here
| Reference: Kozlowski LP. Proteome-pI 2.0: Proteome Isoelectric Point Database Update. Nucleic Acids Res. 2021, doi: 10.1093/nar/gkab944 | Contact: Lukasz P. Kozlowski |