Leptospira ryugenii
Taxonomy: cellular organisms; Bacteria; Spirochaetes; Spirochaetia; Leptospirales; Leptospiraceae; Leptospira
Average proteome isoelectric point is 6.74
Get precalculated fractions of proteins
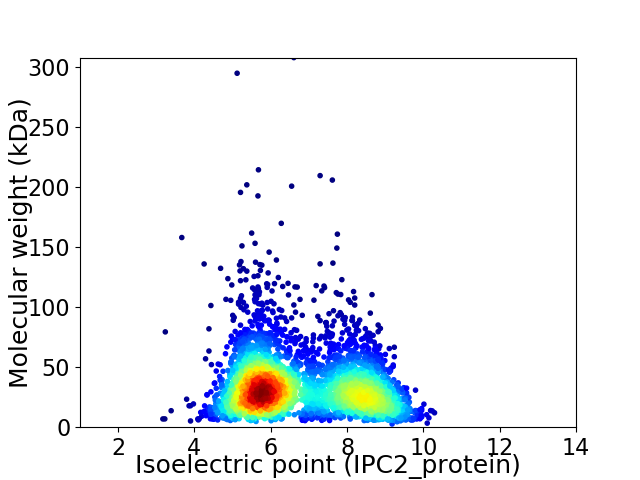
Virtual 2D-PAGE plot for 3659 proteins (isoelectric point calculated using IPC2_protein)
Get csv file with sequences according to given criteria:
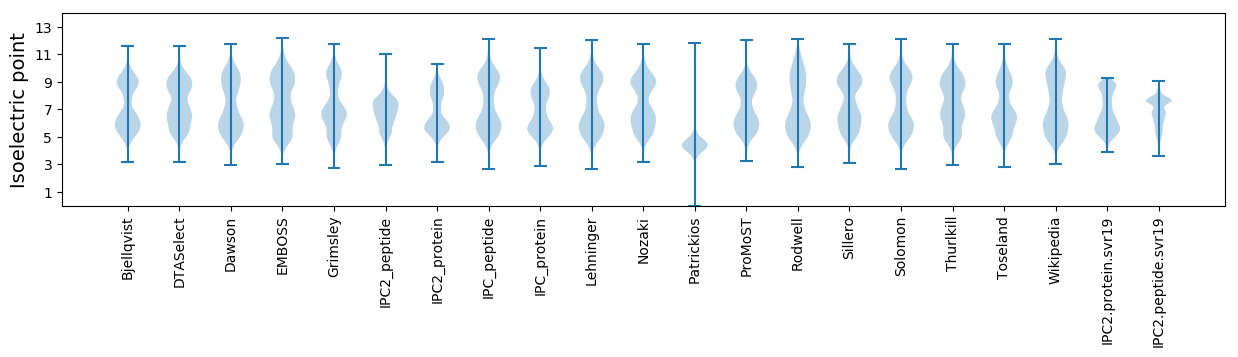
* You can choose from 21 different methods for calculating isoelectric point
Summary statistics related to proteome-wise predictions
Protein with the lowest isoelectric point:
>tr|A0A2P2E5F7|A0A2P2E5F7_9LEPT Methyltransferase OS=Leptospira ryugenii OX=1917863 GN=LPTSP4_36450 PE=3 SV=1
MM1 pKa = 7.01FAEE4 pKa = 5.42LEE6 pKa = 4.42SSCNGTTAFGNAGTGGDD23 pKa = 3.99FNLLQSNTAPAGYY36 pKa = 8.6PYY38 pKa = 11.63YY39 pKa = 9.77MISVDD44 pKa = 3.59TTAKK48 pKa = 10.42DD49 pKa = 3.51VNNVSFPSTFNFSMEE64 pKa = 3.99AKK66 pKa = 10.21
MM1 pKa = 7.01FAEE4 pKa = 5.42LEE6 pKa = 4.42SSCNGTTAFGNAGTGGDD23 pKa = 3.99FNLLQSNTAPAGYY36 pKa = 8.6PYY38 pKa = 11.63YY39 pKa = 9.77MISVDD44 pKa = 3.59TTAKK48 pKa = 10.42DD49 pKa = 3.51VNNVSFPSTFNFSMEE64 pKa = 3.99AKK66 pKa = 10.21
Molecular weight: 7.0 kDa
Isoelectric point according different methods:
Protein with the highest isoelectric point:
>tr|A0A2P2DXK1|A0A2P2DXK1_9LEPT DedA-like protein OS=Leptospira ryugenii OX=1917863 GN=LPTSP4_08630 PE=3 SV=1
MM1 pKa = 7.29VDD3 pKa = 4.26SRR5 pKa = 11.84FLLDD9 pKa = 4.16GFLDD13 pKa = 3.99LVEE16 pKa = 4.05GLIWGMVRR24 pKa = 11.84SRR26 pKa = 11.84SRR28 pKa = 11.84IRR30 pKa = 11.84RR31 pKa = 11.84SLYY34 pKa = 10.38LINHH38 pKa = 5.51VHH40 pKa = 6.78PAQNVRR46 pKa = 11.84KK47 pKa = 8.93QKK49 pKa = 10.69GMLASIYY56 pKa = 10.57HH57 pKa = 6.16PFGG60 pKa = 4.62
MM1 pKa = 7.29VDD3 pKa = 4.26SRR5 pKa = 11.84FLLDD9 pKa = 4.16GFLDD13 pKa = 3.99LVEE16 pKa = 4.05GLIWGMVRR24 pKa = 11.84SRR26 pKa = 11.84SRR28 pKa = 11.84IRR30 pKa = 11.84RR31 pKa = 11.84SLYY34 pKa = 10.38LINHH38 pKa = 5.51VHH40 pKa = 6.78PAQNVRR46 pKa = 11.84KK47 pKa = 8.93QKK49 pKa = 10.69GMLASIYY56 pKa = 10.57HH57 pKa = 6.16PFGG60 pKa = 4.62
Molecular weight: 7.0 kDa
Isoelectric point according different methods:
Peptides (in silico digests for buttom-up proteomics)
Below you can find in silico digests of the whole proteome with Trypsin, Chymotrypsin, Trypsin+LysC, LysN, ArgC proteases suitable for different mass spec machines.| Try ESI |
 |
|---|
| ChTry ESI |
|
|---|
| ArgC ESI |
|
|---|
| LysN ESI |
|
|---|
| TryLysC ESI |
|
|---|
| Try MALDI |
|
|---|
| ChTry MALDI |
|
|---|
| ArgC MALDI |
|
|---|
| LysN MALDI |
|
|---|
| TryLysC MALDI |
|
|---|
| Try LTQ |
|
|---|
| ChTry LTQ |
|
|---|
| ArgC LTQ |
|
|---|
| LysN LTQ |
|
|---|
| TryLysC LTQ |
|
|---|
| Try MSlow |
|
|---|
| ChTry MSlow |
|
|---|
| ArgC MSlow |
|
|---|
| LysN MSlow |
|
|---|
| TryLysC MSlow |
|
|---|
| Try MShigh |
|
|---|
| ChTry MShigh |
|
|---|
| ArgC MShigh |
|
|---|
| LysN MShigh |
|
|---|
| TryLysC MShigh |
|
|---|
General Statistics
Number of major isoforms |
Number of additional isoforms |
Number of all proteins |
Number of amino acids |
Min. Seq. Length |
Max. Seq. Length |
Avg. Seq. Length |
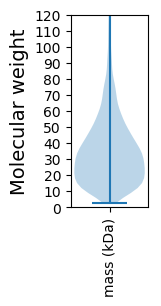
Avg. Mol. Weight |
|---|---|---|---|---|---|---|---|
0 |
1185067 |
23 |
2707 |
323.9 |
36.65 |
Amino acid frequency
Ala |
Cys |
Asp |
Glu |
Phe |
Gly |
His |
Ile |
Lys |
Leu |
|---|---|---|---|---|---|---|---|---|---|
6.137 ± 0.036 | 0.773 ± 0.011 |
4.891 ± 0.025 | 7.237 ± 0.044 |
5.541 ± 0.037 | 6.368 ± 0.037 |
1.853 ± 0.02 | 7.484 ± 0.032 |
7.446 ± 0.042 | 10.569 ± 0.049 |
Met |
Asn |
Gln |
Pro |
Arg |
Ser |
Thr |
Val |
Trp |
Tyr |
|---|---|---|---|---|---|---|---|---|---|
2.046 ± 0.017 | 4.546 ± 0.03 |
3.937 ± 0.023 | 3.718 ± 0.022 |
4.446 ± 0.025 | 7.569 ± 0.037 |
4.951 ± 0.029 | 5.769 ± 0.031 |
1.13 ± 0.015 | 3.59 ± 0.025 |
Most of the basic statistics you can see at this page can be downloaded from this CSV file
See this proteome in:

Proteome-pI is available under Creative Commons Attribution-NoDerivs license, for more details see here
| Reference: Kozlowski LP. Proteome-pI 2.0: Proteome Isoelectric Point Database Update. Nucleic Acids Res. 2021, doi: 10.1093/nar/gkab944 | Contact: Lukasz P. Kozlowski |