Bos taurus (Bovine)
Taxonomy: cellular organisms; Eukaryota; Opisthokonta; Metazoa; Eumetazoa; Bilateria; Deuterostomia; Chordata; Craniata; Vertebrata; Gnathostomata; Teleostomi; Euteleostomi; Sarcopterygii; Dipnotetrapodomorpha; Tetrapoda; Amniota; Mammalia; Theria;
Average proteome isoelectric point is 6.76
Get precalculated fractions of proteins
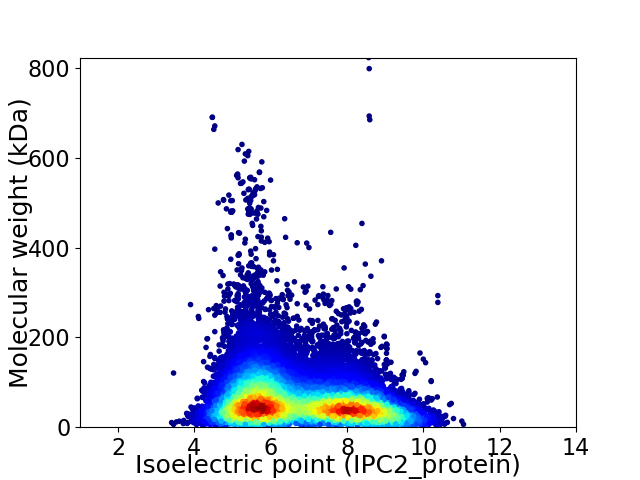
Virtual 2D-PAGE plot for 37882 proteins (isoelectric point calculated using IPC2_protein)
Get csv file with sequences according to given criteria:
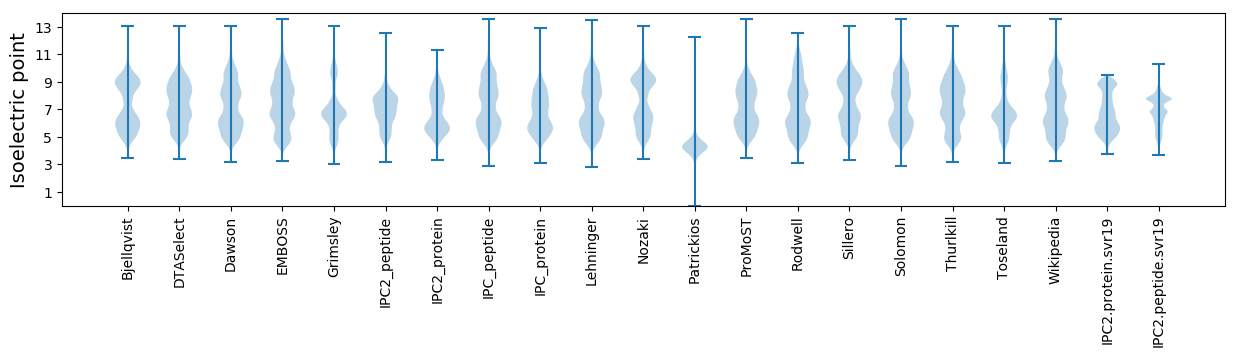
* You can choose from 21 different methods for calculating isoelectric point
Summary statistics related to proteome-wise predictions
Protein with the lowest isoelectric point:
>sp|A8QW39|F183A_BOVIN Protein FAM183A OS=Bos taurus OX=9913 GN=FAM183A PE=2 SV=1
MM1 pKa = 8.24DD2 pKa = 4.75FQQLADD8 pKa = 4.22VAEE11 pKa = 4.71KK12 pKa = 9.75WCSNTPFEE20 pKa = 5.73LIATEE25 pKa = 3.96EE26 pKa = 4.32TEE28 pKa = 4.33RR29 pKa = 11.84RR30 pKa = 11.84MDD32 pKa = 4.29FYY34 pKa = 11.47ADD36 pKa = 3.74PGVSFYY42 pKa = 10.98VLCPDD47 pKa = 4.64NGCGDD52 pKa = 3.96NFHH55 pKa = 6.3VWSEE59 pKa = 4.48SEE61 pKa = 3.97DD62 pKa = 3.63CLPFLQLAQDD72 pKa = 4.45YY73 pKa = 10.71ISSCGKK79 pKa = 8.56KK80 pKa = 7.94TLHH83 pKa = 6.31EE84 pKa = 4.11VLEE87 pKa = 4.47KK88 pKa = 10.61VFKK91 pKa = 10.63SFRR94 pKa = 11.84PLLGLPDD101 pKa = 4.83ADD103 pKa = 3.93DD104 pKa = 4.59DD105 pKa = 4.62AFEE108 pKa = 4.77EE109 pKa = 4.52YY110 pKa = 10.51SADD113 pKa = 3.68VEE115 pKa = 4.38EE116 pKa = 5.09EE117 pKa = 4.2EE118 pKa = 5.29PEE120 pKa = 4.13ADD122 pKa = 3.66HH123 pKa = 6.65PQMGVSQQQ131 pKa = 3.0
MM1 pKa = 8.24DD2 pKa = 4.75FQQLADD8 pKa = 4.22VAEE11 pKa = 4.71KK12 pKa = 9.75WCSNTPFEE20 pKa = 5.73LIATEE25 pKa = 3.96EE26 pKa = 4.32TEE28 pKa = 4.33RR29 pKa = 11.84RR30 pKa = 11.84MDD32 pKa = 4.29FYY34 pKa = 11.47ADD36 pKa = 3.74PGVSFYY42 pKa = 10.98VLCPDD47 pKa = 4.64NGCGDD52 pKa = 3.96NFHH55 pKa = 6.3VWSEE59 pKa = 4.48SEE61 pKa = 3.97DD62 pKa = 3.63CLPFLQLAQDD72 pKa = 4.45YY73 pKa = 10.71ISSCGKK79 pKa = 8.56KK80 pKa = 7.94TLHH83 pKa = 6.31EE84 pKa = 4.11VLEE87 pKa = 4.47KK88 pKa = 10.61VFKK91 pKa = 10.63SFRR94 pKa = 11.84PLLGLPDD101 pKa = 4.83ADD103 pKa = 3.93DD104 pKa = 4.59DD105 pKa = 4.62AFEE108 pKa = 4.77EE109 pKa = 4.52YY110 pKa = 10.51SADD113 pKa = 3.68VEE115 pKa = 4.38EE116 pKa = 5.09EE117 pKa = 4.2EE118 pKa = 5.29PEE120 pKa = 4.13ADD122 pKa = 3.66HH123 pKa = 6.65PQMGVSQQQ131 pKa = 3.0
Molecular weight: 14.93 kDa
Isoelectric point according different methods:
Protein with the highest isoelectric point:
>tr|A0A3Q1LRN5|A0A3Q1LRN5_BOVIN Uncharacterized protein OS=Bos taurus OX=9913 GN=ZNF454 PE=4 SV=1
RR1 pKa = 7.4SPHH4 pKa = 4.88TAGRR8 pKa = 11.84SPHH11 pKa = 5.18TAGRR15 pKa = 11.84SPHH18 pKa = 5.18TAGRR22 pKa = 11.84SPHH25 pKa = 5.18TAGRR29 pKa = 11.84SPHH32 pKa = 5.18TAGRR36 pKa = 11.84SPHH39 pKa = 5.18TAGRR43 pKa = 11.84SPHH46 pKa = 4.96TRR48 pKa = 11.84VRR50 pKa = 11.84TPHH53 pKa = 5.34TAGRR57 pKa = 11.84SPHH60 pKa = 5.18TAGRR64 pKa = 11.84SPHH67 pKa = 5.18TAGRR71 pKa = 11.84SPHH74 pKa = 5.61TAGGSPHH81 pKa = 5.85TAGRR85 pKa = 11.84SPHH88 pKa = 4.85TAGRR92 pKa = 11.84IRR94 pKa = 11.84TPHH97 pKa = 5.21TAGRR101 pKa = 11.84SPHH104 pKa = 5.18TAGRR108 pKa = 11.84SPHH111 pKa = 5.61TAGGSPHH118 pKa = 6.22TRR120 pKa = 11.84VKK122 pKa = 10.06TPHH125 pKa = 5.45TAGRR129 pKa = 11.84SPHH132 pKa = 5.18TAGRR136 pKa = 11.84SPHH139 pKa = 5.18TAGRR143 pKa = 11.84SPHH146 pKa = 4.96TRR148 pKa = 11.84VRR150 pKa = 11.84TPHH153 pKa = 5.34TAGRR157 pKa = 11.84SPHH160 pKa = 5.18TAGRR164 pKa = 11.84SPHH167 pKa = 4.96TQGEE171 pKa = 4.33AFLL174 pKa = 5.21
RR1 pKa = 7.4SPHH4 pKa = 4.88TAGRR8 pKa = 11.84SPHH11 pKa = 5.18TAGRR15 pKa = 11.84SPHH18 pKa = 5.18TAGRR22 pKa = 11.84SPHH25 pKa = 5.18TAGRR29 pKa = 11.84SPHH32 pKa = 5.18TAGRR36 pKa = 11.84SPHH39 pKa = 5.18TAGRR43 pKa = 11.84SPHH46 pKa = 4.96TRR48 pKa = 11.84VRR50 pKa = 11.84TPHH53 pKa = 5.34TAGRR57 pKa = 11.84SPHH60 pKa = 5.18TAGRR64 pKa = 11.84SPHH67 pKa = 5.18TAGRR71 pKa = 11.84SPHH74 pKa = 5.61TAGGSPHH81 pKa = 5.85TAGRR85 pKa = 11.84SPHH88 pKa = 4.85TAGRR92 pKa = 11.84IRR94 pKa = 11.84TPHH97 pKa = 5.21TAGRR101 pKa = 11.84SPHH104 pKa = 5.18TAGRR108 pKa = 11.84SPHH111 pKa = 5.61TAGGSPHH118 pKa = 6.22TRR120 pKa = 11.84VKK122 pKa = 10.06TPHH125 pKa = 5.45TAGRR129 pKa = 11.84SPHH132 pKa = 5.18TAGRR136 pKa = 11.84SPHH139 pKa = 5.18TAGRR143 pKa = 11.84SPHH146 pKa = 4.96TRR148 pKa = 11.84VRR150 pKa = 11.84TPHH153 pKa = 5.34TAGRR157 pKa = 11.84SPHH160 pKa = 5.18TAGRR164 pKa = 11.84SPHH167 pKa = 4.96TQGEE171 pKa = 4.33AFLL174 pKa = 5.21
Molecular weight: 17.98 kDa
Isoelectric point according different methods:
Peptides (in silico digests for buttom-up proteomics)
Below you can find in silico digests of the whole proteome with Trypsin, Chymotrypsin, Trypsin+LysC, LysN, ArgC proteases suitable for different mass spec machines.| Try ESI |
 |
|---|
| ChTry ESI |
|
|---|
| ArgC ESI |
|
|---|
| LysN ESI |
|
|---|
| TryLysC ESI |
|
|---|
| Try MALDI |
|
|---|
| ChTry MALDI |
|
|---|
| ArgC MALDI |
|
|---|
| LysN MALDI |
|
|---|
| TryLysC MALDI |
|
|---|
| Try LTQ |
|
|---|
| ChTry LTQ |
|
|---|
| ArgC LTQ |
|
|---|
| LysN LTQ |
|
|---|
| TryLysC LTQ |
|
|---|
| Try MSlow |
|
|---|
| ChTry MSlow |
|
|---|
| ArgC MSlow |
|
|---|
| LysN MSlow |
|
|---|
| TryLysC MSlow |
|
|---|
| Try MShigh |
|
|---|
| ChTry MShigh |
|
|---|
| ArgC MShigh |
|
|---|
| LysN MShigh |
|
|---|
| TryLysC MShigh |
|
|---|
General Statistics
Number of major isoforms |
Number of additional isoforms |
Number of all proteins |
Number of amino acids |
Min. Seq. Length |
Max. Seq. Length |
Avg. Seq. Length |
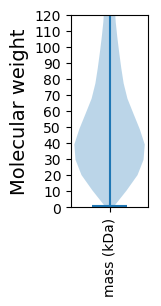
Avg. Mol. Weight |
|---|---|---|---|---|---|---|---|
22676720 |
8 |
8139 |
598.6 |
66.67 |
Amino acid frequency
Ala |
Cys |
Asp |
Glu |
Phe |
Gly |
His |
Ile |
Lys |
Leu |
|---|---|---|---|---|---|---|---|---|---|
7.059 ± 0.014 | 2.228 ± 0.013 |
4.845 ± 0.009 | 7.069 ± 0.016 |
3.653 ± 0.009 | 6.577 ± 0.017 |
2.536 ± 0.006 | 4.379 ± 0.011 |
5.684 ± 0.014 | 10.0 ± 0.018 |
Met |
Asn |
Gln |
Pro |
Arg |
Ser |
Thr |
Val |
Trp |
Tyr |
|---|---|---|---|---|---|---|---|---|---|
2.124 ± 0.006 | 3.558 ± 0.009 |
6.317 ± 0.019 | 4.721 ± 0.01 |
5.719 ± 0.012 | 8.31 ± 0.017 |
5.277 ± 0.01 | 6.069 ± 0.011 |
1.227 ± 0.005 | 2.648 ± 0.008 |
Most of the basic statistics you can see at this page can be downloaded from this CSV file
See this proteome in:

Proteome-pI is available under Creative Commons Attribution-NoDerivs license, for more details see here
| Reference: Kozlowski LP. Proteome-pI 2.0: Proteome Isoelectric Point Database Update. Nucleic Acids Res. 2021, doi: 10.1093/nar/gkab944 | Contact: Lukasz P. Kozlowski |