Megasphaera sp. UPII 135-E
Taxonomy: cellular organisms; Bacteria; Terrabacteria group; Firmicutes; Negativicutes; Veillonellales; Veillonellaceae; Megasphaera; unclassified Megasphaera
Average proteome isoelectric point is 6.83
Get precalculated fractions of proteins
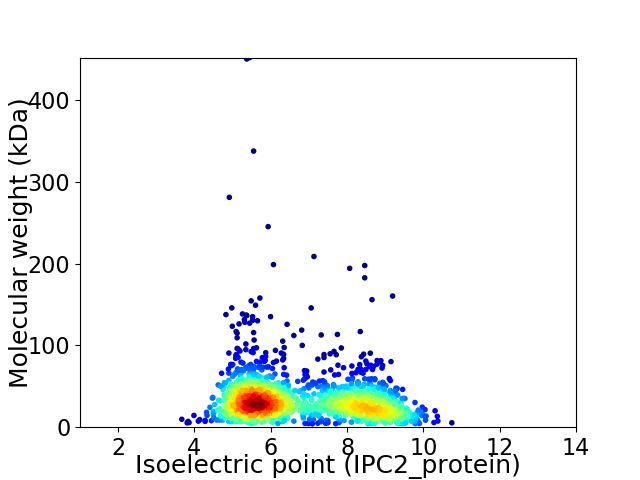
Virtual 2D-PAGE plot for 1512 proteins (isoelectric point calculated using IPC2_protein)
Get csv file with sequences according to given criteria:
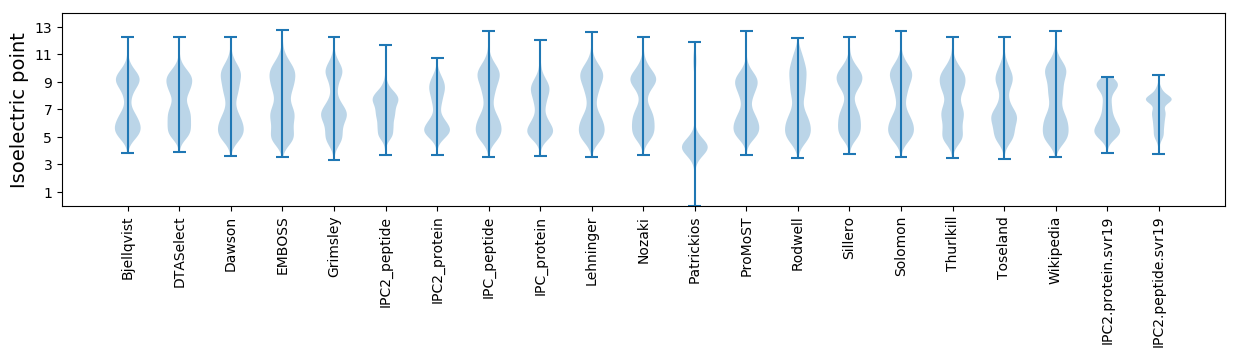
* You can choose from 21 different methods for calculating isoelectric point
Summary statistics related to proteome-wise predictions
Protein with the lowest isoelectric point:
>tr|F9MQL0|F9MQL0_9FIRM UvrABC system protein A OS=Megasphaera sp. UPII 135-E OX=1000569 GN=uvrA PE=3 SV=1
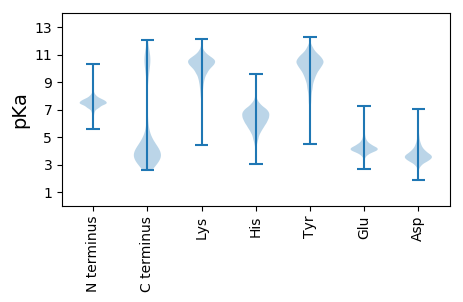
MM1 pKa = 8.05DD2 pKa = 5.19KK3 pKa = 11.22YY4 pKa = 10.8EE5 pKa = 4.4CTVCGYY11 pKa = 10.14IYY13 pKa = 10.76DD14 pKa = 4.11EE15 pKa = 5.33AEE17 pKa = 3.85GDD19 pKa = 3.58ADD21 pKa = 3.79NGISAGTKK29 pKa = 9.77FADD32 pKa = 4.75LAPDD36 pKa = 4.11WMCPMCGADD45 pKa = 3.26KK46 pKa = 11.18GSFVKK51 pKa = 10.48VDD53 pKa = 3.1
MM1 pKa = 8.05DD2 pKa = 5.19KK3 pKa = 11.22YY4 pKa = 10.8EE5 pKa = 4.4CTVCGYY11 pKa = 10.14IYY13 pKa = 10.76DD14 pKa = 4.11EE15 pKa = 5.33AEE17 pKa = 3.85GDD19 pKa = 3.58ADD21 pKa = 3.79NGISAGTKK29 pKa = 9.77FADD32 pKa = 4.75LAPDD36 pKa = 4.11WMCPMCGADD45 pKa = 3.26KK46 pKa = 11.18GSFVKK51 pKa = 10.48VDD53 pKa = 3.1
Molecular weight: 5.71 kDa
Isoelectric point according different methods:
Protein with the highest isoelectric point:
>tr|F9MQC3|F9MQC3_9FIRM tRNA dimethylallyltransferase OS=Megasphaera sp. UPII 135-E OX=1000569 GN=miaA PE=3 SV=1
MM1 pKa = 7.11LTHH4 pKa = 7.31GIAGCIPCFFSAGLVSLVLGNEE26 pKa = 3.95RR27 pKa = 11.84NTGVFIALRR36 pKa = 11.84MLAYY40 pKa = 9.44TFLFILKK47 pKa = 10.14ISIKK51 pKa = 10.26RR52 pKa = 11.84RR53 pKa = 3.34
MM1 pKa = 7.11LTHH4 pKa = 7.31GIAGCIPCFFSAGLVSLVLGNEE26 pKa = 3.95RR27 pKa = 11.84NTGVFIALRR36 pKa = 11.84MLAYY40 pKa = 9.44TFLFILKK47 pKa = 10.14ISIKK51 pKa = 10.26RR52 pKa = 11.84RR53 pKa = 3.34
Molecular weight: 5.87 kDa
Isoelectric point according different methods:
Peptides (in silico digests for buttom-up proteomics)
Below you can find in silico digests of the whole proteome with Trypsin, Chymotrypsin, Trypsin+LysC, LysN, ArgC proteases suitable for different mass spec machines.| Try ESI |
 |
|---|
| ChTry ESI |
|
|---|
| ArgC ESI |
|
|---|
| LysN ESI |
|
|---|
| TryLysC ESI |
|
|---|
| Try MALDI |
|
|---|
| ChTry MALDI |
|
|---|
| ArgC MALDI |
|
|---|
| LysN MALDI |
|
|---|
| TryLysC MALDI |
|
|---|
| Try LTQ |
|
|---|
| ChTry LTQ |
|
|---|
| ArgC LTQ |
|
|---|
| LysN LTQ |
|
|---|
| TryLysC LTQ |
|
|---|
| Try MSlow |
|
|---|
| ChTry MSlow |
|
|---|
| ArgC MSlow |
|
|---|
| LysN MSlow |
|
|---|
| TryLysC MSlow |
|
|---|
| Try MShigh |
|
|---|
| ChTry MShigh |
|
|---|
| ArgC MShigh |
|
|---|
| LysN MShigh |
|
|---|
| TryLysC MShigh |
|
|---|
General Statistics
Number of major isoforms |
Number of additional isoforms |
Number of all proteins |
Number of amino acids |
Min. Seq. Length |
Max. Seq. Length |
Avg. Seq. Length |
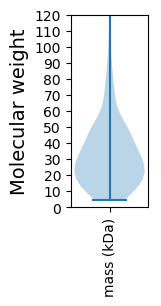
Avg. Mol. Weight |
|---|---|---|---|---|---|---|---|
0 |
491780 |
37 |
4354 |
325.3 |
36.27 |
Amino acid frequency
Ala |
Cys |
Asp |
Glu |
Phe |
Gly |
His |
Ile |
Lys |
Leu |
|---|---|---|---|---|---|---|---|---|---|
8.067 ± 0.094 | 1.311 ± 0.033 |
5.21 ± 0.084 | 6.287 ± 0.08 |
3.693 ± 0.053 | 7.329 ± 0.109 |
2.316 ± 0.04 | 7.696 ± 0.078 |
6.581 ± 0.096 | 9.032 ± 0.089 |
Met |
Asn |
Gln |
Pro |
Arg |
Ser |
Thr |
Val |
Trp |
Tyr |
|---|---|---|---|---|---|---|---|---|---|
2.911 ± 0.035 | 3.9 ± 0.088 |
3.54 ± 0.051 | 4.201 ± 0.056 |
4.65 ± 0.075 | 5.374 ± 0.05 |
5.91 ± 0.084 | 7.324 ± 0.057 |
0.963 ± 0.025 | 3.705 ± 0.059 |
Most of the basic statistics you can see at this page can be downloaded from this CSV file
See this proteome in:

Proteome-pI is available under Creative Commons Attribution-NoDerivs license, for more details see here
| Reference: Kozlowski LP. Proteome-pI 2.0: Proteome Isoelectric Point Database Update. Nucleic Acids Res. 2021, doi: 10.1093/nar/gkab944 | Contact: Lukasz P. Kozlowski |