Raphidiopsis brookii D9
Taxonomy: cellular organisms; Bacteria; Terrabacteria group; Cyanobacteria/Melainabacteria group; Cyanobacteria; Nostocales; Aphanizomenonaceae; Raphidiopsis; Raphidiopsis brookii
Average proteome isoelectric point is 6.49
Get precalculated fractions of proteins
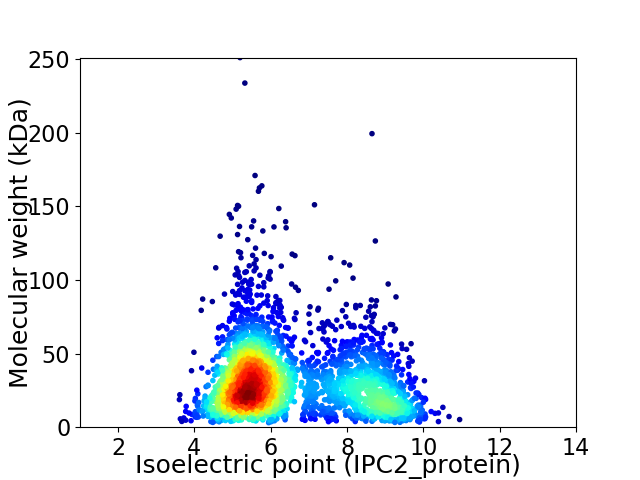
Virtual 2D-PAGE plot for 3007 proteins (isoelectric point calculated using IPC2_protein)
Get csv file with sequences according to given criteria:
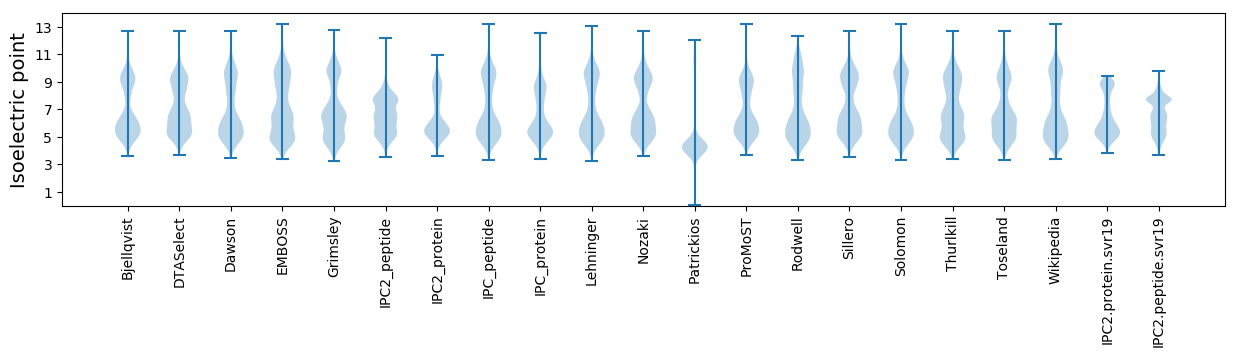
* You can choose from 21 different methods for calculating isoelectric point
Summary statistics related to proteome-wise predictions
Protein with the lowest isoelectric point:
>tr|D4TMS5|D4TMS5_9CYAN Heat shock protein DnaJ-like protein OS=Raphidiopsis brookii D9 OX=533247 GN=CRD_00239 PE=4 SV=1
MM1 pKa = 7.68NDD3 pKa = 2.62GHH5 pKa = 6.56YY6 pKa = 10.77LIGLYY11 pKa = 9.92QSQLSISATTPAWTDD26 pKa = 2.63IDD28 pKa = 4.48ILDD31 pKa = 4.44NLDD34 pKa = 3.64NLIDD38 pKa = 3.96PSVFFTTDD46 pKa = 2.68LGKK49 pKa = 10.96YY50 pKa = 8.6GG51 pKa = 3.58
MM1 pKa = 7.68NDD3 pKa = 2.62GHH5 pKa = 6.56YY6 pKa = 10.77LIGLYY11 pKa = 9.92QSQLSISATTPAWTDD26 pKa = 2.63IDD28 pKa = 4.48ILDD31 pKa = 4.44NLDD34 pKa = 3.64NLIDD38 pKa = 3.96PSVFFTTDD46 pKa = 2.68LGKK49 pKa = 10.96YY50 pKa = 8.6GG51 pKa = 3.58
Molecular weight: 5.66 kDa
Isoelectric point according different methods:
Protein with the highest isoelectric point:
>tr|D4TV06|D4TV06_9CYAN Peptidoglycan glycosyltransferase RodA OS=Raphidiopsis brookii D9 OX=533247 GN=rodA PE=3 SV=1
MM1 pKa = 7.08QRR3 pKa = 11.84TLGGTCRR10 pKa = 11.84KK11 pKa = 9.61RR12 pKa = 11.84KK13 pKa = 7.61RR14 pKa = 11.84TSGFRR19 pKa = 11.84ARR21 pKa = 11.84MQTPTGRR28 pKa = 11.84NVIRR32 pKa = 11.84TRR34 pKa = 11.84RR35 pKa = 11.84KK36 pKa = 8.96KK37 pKa = 9.82GRR39 pKa = 11.84HH40 pKa = 5.0RR41 pKa = 11.84LSVV44 pKa = 3.12
MM1 pKa = 7.08QRR3 pKa = 11.84TLGGTCRR10 pKa = 11.84KK11 pKa = 9.61RR12 pKa = 11.84KK13 pKa = 7.61RR14 pKa = 11.84TSGFRR19 pKa = 11.84ARR21 pKa = 11.84MQTPTGRR28 pKa = 11.84NVIRR32 pKa = 11.84TRR34 pKa = 11.84RR35 pKa = 11.84KK36 pKa = 8.96KK37 pKa = 9.82GRR39 pKa = 11.84HH40 pKa = 5.0RR41 pKa = 11.84LSVV44 pKa = 3.12
Molecular weight: 5.2 kDa
Isoelectric point according different methods:
Peptides (in silico digests for buttom-up proteomics)
Below you can find in silico digests of the whole proteome with Trypsin, Chymotrypsin, Trypsin+LysC, LysN, ArgC proteases suitable for different mass spec machines.| Try ESI |
 |
|---|
| ChTry ESI |
|
|---|
| ArgC ESI |
|
|---|
| LysN ESI |
|
|---|
| TryLysC ESI |
|
|---|
| Try MALDI |
|
|---|
| ChTry MALDI |
|
|---|
| ArgC MALDI |
|
|---|
| LysN MALDI |
|
|---|
| TryLysC MALDI |
|
|---|
| Try LTQ |
|
|---|
| ChTry LTQ |
|
|---|
| ArgC LTQ |
|
|---|
| LysN LTQ |
|
|---|
| TryLysC LTQ |
|
|---|
| Try MSlow |
|
|---|
| ChTry MSlow |
|
|---|
| ArgC MSlow |
|
|---|
| LysN MSlow |
|
|---|
| TryLysC MSlow |
|
|---|
| Try MShigh |
|
|---|
| ChTry MShigh |
|
|---|
| ArgC MShigh |
|
|---|
| LysN MShigh |
|
|---|
| TryLysC MShigh |
|
|---|
General Statistics
Number of major isoforms |
Number of additional isoforms |
Number of all proteins |
Number of amino acids |
Min. Seq. Length |
Max. Seq. Length |
Avg. Seq. Length |
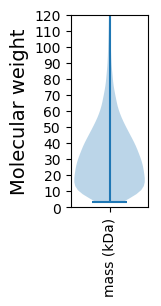
Avg. Mol. Weight |
|---|---|---|---|---|---|---|---|
0 |
904229 |
29 |
2249 |
300.7 |
33.63 |
Amino acid frequency
Ala |
Cys |
Asp |
Glu |
Phe |
Gly |
His |
Ile |
Lys |
Leu |
|---|---|---|---|---|---|---|---|---|---|
7.036 ± 0.049 | 1.017 ± 0.015 |
4.762 ± 0.029 | 6.161 ± 0.046 |
3.899 ± 0.03 | 6.905 ± 0.04 |
1.99 ± 0.023 | 7.362 ± 0.035 |
5.162 ± 0.037 | 11.042 ± 0.053 |
Met |
Asn |
Gln |
Pro |
Arg |
Ser |
Thr |
Val |
Trp |
Tyr |
|---|---|---|---|---|---|---|---|---|---|
1.997 ± 0.02 | 4.579 ± 0.032 |
4.688 ± 0.032 | 5.179 ± 0.035 |
4.951 ± 0.031 | 6.461 ± 0.032 |
5.586 ± 0.029 | 6.644 ± 0.031 |
1.423 ± 0.025 | 3.157 ± 0.028 |
Most of the basic statistics you can see at this page can be downloaded from this CSV file
See this proteome in:

Proteome-pI is available under Creative Commons Attribution-NoDerivs license, for more details see here
| Reference: Kozlowski LP. Proteome-pI 2.0: Proteome Isoelectric Point Database Update. Nucleic Acids Res. 2021, doi: 10.1093/nar/gkab944 | Contact: Lukasz P. Kozlowski |