Pseudomonas oryzihabitans
Taxonomy: cellular organisms; Bacteria; Proteobacteria; Gammaproteobacteria; Pseudomonadales; Pseudomonadaceae; Pseudomonas; Pseudomonas putida group
Average proteome isoelectric point is 6.46
Get precalculated fractions of proteins
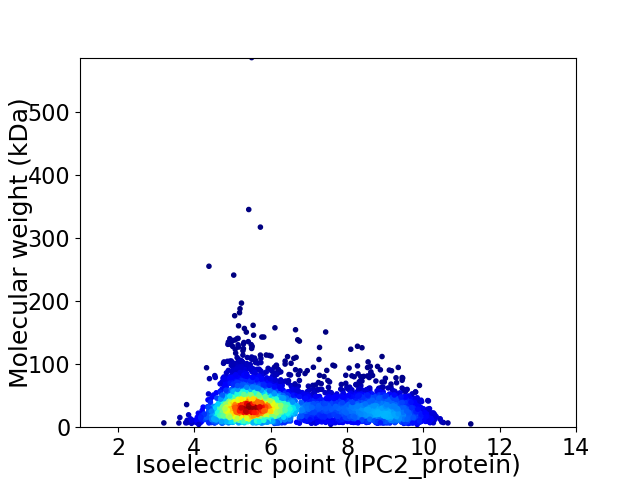
Virtual 2D-PAGE plot for 4281 proteins (isoelectric point calculated using IPC2_protein)
Get csv file with sequences according to given criteria:
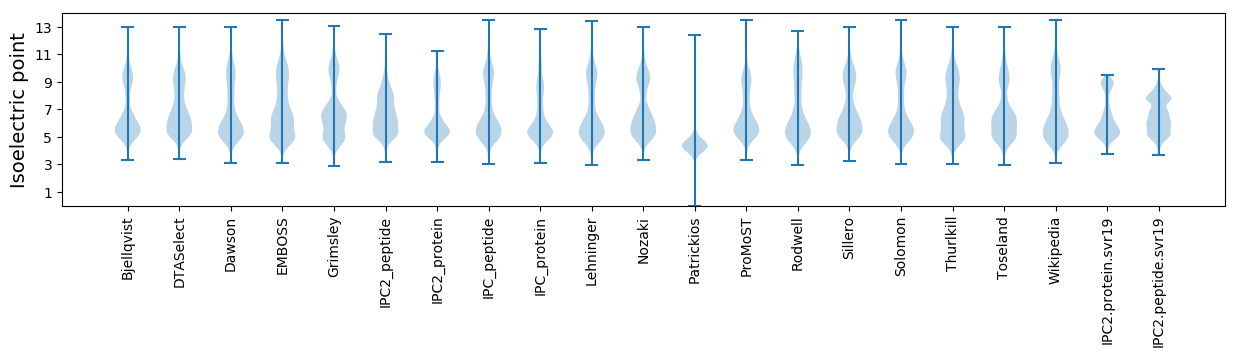
* You can choose from 21 different methods for calculating isoelectric point
Summary statistics related to proteome-wise predictions
Protein with the lowest isoelectric point:
>tr|A0A0D7FBV7|A0A0D7FBV7_9PSED ABC transporter ATP-binding protein OS=Pseudomonas oryzihabitans OX=47885 GN=A4V15_09495 PE=4 SV=1
MM1 pKa = 7.83RR2 pKa = 11.84KK3 pKa = 7.57WQCIVCGYY11 pKa = 10.3IYY13 pKa = 10.54DD14 pKa = 4.33EE15 pKa = 4.4ALGWPDD21 pKa = 5.12DD22 pKa = 4.61GIAPGTRR29 pKa = 11.84WEE31 pKa = 4.75DD32 pKa = 3.57VPEE35 pKa = 4.63DD36 pKa = 4.22WLCPDD41 pKa = 4.21CGVGKK46 pKa = 10.88GDD48 pKa = 4.32FEE50 pKa = 4.8MIAIGG55 pKa = 4.11
MM1 pKa = 7.83RR2 pKa = 11.84KK3 pKa = 7.57WQCIVCGYY11 pKa = 10.3IYY13 pKa = 10.54DD14 pKa = 4.33EE15 pKa = 4.4ALGWPDD21 pKa = 5.12DD22 pKa = 4.61GIAPGTRR29 pKa = 11.84WEE31 pKa = 4.75DD32 pKa = 3.57VPEE35 pKa = 4.63DD36 pKa = 4.22WLCPDD41 pKa = 4.21CGVGKK46 pKa = 10.88GDD48 pKa = 4.32FEE50 pKa = 4.8MIAIGG55 pKa = 4.11
Molecular weight: 6.18 kDa
Isoelectric point according different methods:
Protein with the highest isoelectric point:
>tr|A0A0U4WFK4|A0A0U4WFK4_9PSED Energy transducer TonB OS=Pseudomonas oryzihabitans OX=47885 GN=APT59_02565 PE=4 SV=1
MM1 pKa = 7.45KK2 pKa = 9.56RR3 pKa = 11.84TFQPSTLKK11 pKa = 10.31RR12 pKa = 11.84ARR14 pKa = 11.84VHH16 pKa = 6.26GFRR19 pKa = 11.84ARR21 pKa = 11.84MATKK25 pKa = 10.29NGRR28 pKa = 11.84QVLSRR33 pKa = 11.84RR34 pKa = 11.84RR35 pKa = 11.84AKK37 pKa = 9.98GRR39 pKa = 11.84KK40 pKa = 8.8RR41 pKa = 11.84LAII44 pKa = 4.0
MM1 pKa = 7.45KK2 pKa = 9.56RR3 pKa = 11.84TFQPSTLKK11 pKa = 10.31RR12 pKa = 11.84ARR14 pKa = 11.84VHH16 pKa = 6.26GFRR19 pKa = 11.84ARR21 pKa = 11.84MATKK25 pKa = 10.29NGRR28 pKa = 11.84QVLSRR33 pKa = 11.84RR34 pKa = 11.84RR35 pKa = 11.84AKK37 pKa = 9.98GRR39 pKa = 11.84KK40 pKa = 8.8RR41 pKa = 11.84LAII44 pKa = 4.0
Molecular weight: 5.19 kDa
Isoelectric point according different methods:
Peptides (in silico digests for buttom-up proteomics)
Below you can find in silico digests of the whole proteome with Trypsin, Chymotrypsin, Trypsin+LysC, LysN, ArgC proteases suitable for different mass spec machines.| Try ESI |
 |
|---|
| ChTry ESI |
|
|---|
| ArgC ESI |
|
|---|
| LysN ESI |
|
|---|
| TryLysC ESI |
|
|---|
| Try MALDI |
|
|---|
| ChTry MALDI |
|
|---|
| ArgC MALDI |
|
|---|
| LysN MALDI |
|
|---|
| TryLysC MALDI |
|
|---|
| Try LTQ |
|
|---|
| ChTry LTQ |
|
|---|
| ArgC LTQ |
|
|---|
| LysN LTQ |
|
|---|
| TryLysC LTQ |
|
|---|
| Try MSlow |
|
|---|
| ChTry MSlow |
|
|---|
| ArgC MSlow |
|
|---|
| LysN MSlow |
|
|---|
| TryLysC MSlow |
|
|---|
| Try MShigh |
|
|---|
| ChTry MShigh |
|
|---|
| ArgC MShigh |
|
|---|
| LysN MShigh |
|
|---|
| TryLysC MShigh |
|
|---|
General Statistics
Number of major isoforms |
Number of additional isoforms |
Number of all proteins |
Number of amino acids |
Min. Seq. Length |
Max. Seq. Length |
Avg. Seq. Length |
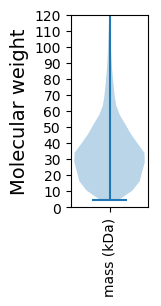
Avg. Mol. Weight |
|---|---|---|---|---|---|---|---|
0 |
1409937 |
38 |
5332 |
329.3 |
35.98 |
Amino acid frequency
Ala |
Cys |
Asp |
Glu |
Phe |
Gly |
His |
Ile |
Lys |
Leu |
|---|---|---|---|---|---|---|---|---|---|
12.015 ± 0.043 | 0.953 ± 0.01 |
5.339 ± 0.027 | 5.791 ± 0.031 |
3.462 ± 0.022 | 8.314 ± 0.032 |
2.17 ± 0.016 | 4.267 ± 0.028 |
2.744 ± 0.034 | 12.626 ± 0.049 |
Met |
Asn |
Gln |
Pro |
Arg |
Ser |
Thr |
Val |
Trp |
Tyr |
|---|---|---|---|---|---|---|---|---|---|
1.984 ± 0.018 | 2.47 ± 0.02 |
5.102 ± 0.033 | 4.573 ± 0.029 |
7.281 ± 0.039 | 5.104 ± 0.024 |
4.888 ± 0.022 | 7.086 ± 0.03 |
1.434 ± 0.016 | 2.395 ± 0.018 |
Most of the basic statistics you can see at this page can be downloaded from this CSV file
See this proteome in:

Proteome-pI is available under Creative Commons Attribution-NoDerivs license, for more details see here
| Reference: Kozlowski LP. Proteome-pI 2.0: Proteome Isoelectric Point Database Update. Nucleic Acids Res. 2021, doi: 10.1093/nar/gkab944 | Contact: Lukasz P. Kozlowski |