Mycobacterium phage Papez
Taxonomy: Viruses; Duplodnaviria; Heunggongvirae; Uroviricota; Caudoviricetes; Caudovirales; Siphoviridae; Fromanvirus; unclassified Fromanvirus
Average proteome isoelectric point is 6.06
Get precalculated fractions of proteins
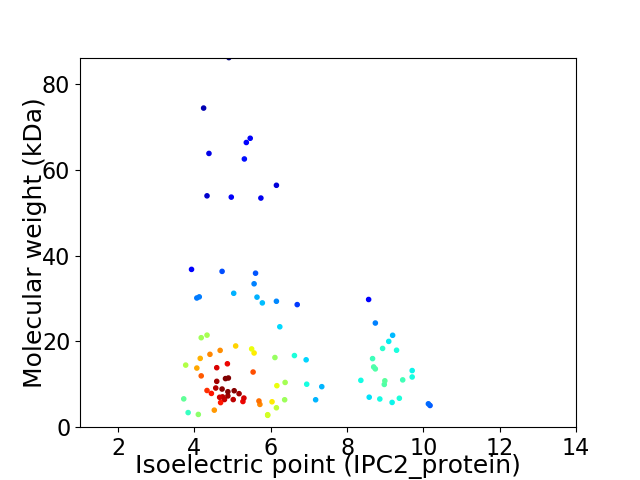
Virtual 2D-PAGE plot for 94 proteins (isoelectric point calculated using IPC2_protein)
Get csv file with sequences according to given criteria:
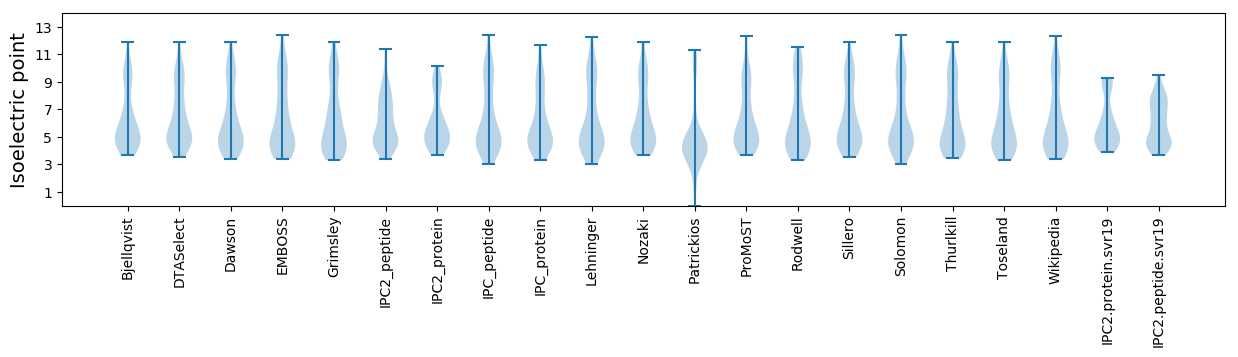
* You can choose from 21 different methods for calculating isoelectric point
Summary statistics related to proteome-wise predictions
Protein with the lowest isoelectric point:
>tr|A0A1B1PCW2|A0A1B1PCW2_9CAUD Uncharacterized protein OS=Mycobacterium phage Papez OX=1873891 GN=1 PE=4 SV=1
MM1 pKa = 7.61GFTLRR6 pKa = 11.84LFGIPVLSLEE16 pKa = 4.13ITGDD20 pKa = 3.64GSAEE24 pKa = 4.06EE25 pKa = 4.65YY26 pKa = 10.37ISLTGGSFEE35 pKa = 4.74LAPEE39 pKa = 3.98EE40 pKa = 4.15PEE42 pKa = 3.9YY43 pKa = 11.13DD44 pKa = 3.29EE45 pKa = 5.61EE46 pKa = 4.95YY47 pKa = 10.82YY48 pKa = 10.93EE49 pKa = 4.22EE50 pKa = 4.6DD51 pKa = 3.1RR52 pKa = 11.84SGFGFGVSS60 pKa = 3.28
MM1 pKa = 7.61GFTLRR6 pKa = 11.84LFGIPVLSLEE16 pKa = 4.13ITGDD20 pKa = 3.64GSAEE24 pKa = 4.06EE25 pKa = 4.65YY26 pKa = 10.37ISLTGGSFEE35 pKa = 4.74LAPEE39 pKa = 3.98EE40 pKa = 4.15PEE42 pKa = 3.9YY43 pKa = 11.13DD44 pKa = 3.29EE45 pKa = 5.61EE46 pKa = 4.95YY47 pKa = 10.82YY48 pKa = 10.93EE49 pKa = 4.22EE50 pKa = 4.6DD51 pKa = 3.1RR52 pKa = 11.84SGFGFGVSS60 pKa = 3.28
Molecular weight: 6.61 kDa
Isoelectric point according different methods:
Protein with the highest isoelectric point:
>tr|A0A1B1PCW0|A0A1B1PCW0_9CAUD Capsid maturation protease OS=Mycobacterium phage Papez OX=1873891 GN=15 PE=4 SV=1
MM1 pKa = 7.3GAAHH5 pKa = 7.34LPACSYY11 pKa = 10.58QLQDD15 pKa = 2.67RR16 pKa = 11.84GMKK19 pKa = 9.82RR20 pKa = 11.84VRR22 pKa = 11.84EE23 pKa = 3.92LVLIRR28 pKa = 11.84MLDD31 pKa = 3.28HH32 pKa = 6.78EE33 pKa = 4.97VRR35 pKa = 11.84LEE37 pKa = 3.73HH38 pKa = 7.22LIQIMRR44 pKa = 11.84GWFRR48 pKa = 3.52
MM1 pKa = 7.3GAAHH5 pKa = 7.34LPACSYY11 pKa = 10.58QLQDD15 pKa = 2.67RR16 pKa = 11.84GMKK19 pKa = 9.82RR20 pKa = 11.84VRR22 pKa = 11.84EE23 pKa = 3.92LVLIRR28 pKa = 11.84MLDD31 pKa = 3.28HH32 pKa = 6.78EE33 pKa = 4.97VRR35 pKa = 11.84LEE37 pKa = 3.73HH38 pKa = 7.22LIQIMRR44 pKa = 11.84GWFRR48 pKa = 3.52
Molecular weight: 5.77 kDa
Isoelectric point according different methods:
Peptides (in silico digests for buttom-up proteomics)
Below you can find in silico digests of the whole proteome with Trypsin, Chymotrypsin, Trypsin+LysC, LysN, ArgC proteases suitable for different mass spec machines.| Try ESI |
 |
|---|
| ChTry ESI |
|
|---|
| ArgC ESI |
|
|---|
| LysN ESI |
|
|---|
| TryLysC ESI |
|
|---|
| Try MALDI |
|
|---|
| ChTry MALDI |
|
|---|
| ArgC MALDI |
|
|---|
| LysN MALDI |
|
|---|
| TryLysC MALDI |
|
|---|
| Try LTQ |
|
|---|
| ChTry LTQ |
|
|---|
| ArgC LTQ |
|
|---|
| LysN LTQ |
|
|---|
| TryLysC LTQ |
|
|---|
| Try MSlow |
|
|---|
| ChTry MSlow |
|
|---|
| ArgC MSlow |
|
|---|
| LysN MSlow |
|
|---|
| TryLysC MSlow |
|
|---|
| Try MShigh |
|
|---|
| ChTry MShigh |
|
|---|
| ArgC MShigh |
|
|---|
| LysN MShigh |
|
|---|
| TryLysC MShigh |
|
|---|
General Statistics
Number of major isoforms |
Number of additional isoforms |
Number of all proteins |
Number of amino acids |
Min. Seq. Length |
Max. Seq. Length |
Avg. Seq. Length |
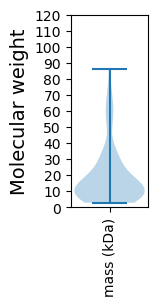
Avg. Mol. Weight |
|---|---|---|---|---|---|---|---|
0 |
16495 |
25 |
826 |
175.5 |
19.29 |
Amino acid frequency
Ala |
Cys |
Asp |
Glu |
Phe |
Gly |
His |
Ile |
Lys |
Leu |
|---|---|---|---|---|---|---|---|---|---|
9.694 ± 0.386 | 0.649 ± 0.111 |
6.547 ± 0.224 | 6.699 ± 0.275 |
3.195 ± 0.189 | 8.706 ± 0.518 |
2.043 ± 0.188 | 4.905 ± 0.215 |
4.129 ± 0.247 | 8.669 ± 0.233 |
Met |
Asn |
Gln |
Pro |
Arg |
Ser |
Thr |
Val |
Trp |
Tyr |
|---|---|---|---|---|---|---|---|---|---|
1.934 ± 0.122 | 3.328 ± 0.145 |
5.511 ± 0.233 | 3.219 ± 0.175 |
6.208 ± 0.42 | 6.014 ± 0.307 |
6.25 ± 0.323 | 7.317 ± 0.208 |
2.098 ± 0.129 | 2.886 ± 0.193 |
Most of the basic statistics you can see at this page can be downloaded from this CSV file
See this proteome in:

Proteome-pI is available under Creative Commons Attribution-NoDerivs license, for more details see here
| Reference: Kozlowski LP. Proteome-pI 2.0: Proteome Isoelectric Point Database Update. Nucleic Acids Res. 2021, doi: 10.1093/nar/gkab944 | Contact: Lukasz P. Kozlowski |