Gemmobacter megaterium
Taxonomy: cellular organisms; Bacteria; Proteobacteria; Alphaproteobacteria; Rhodobacterales; Rhodobacteraceae; Gemmobacter
Average proteome isoelectric point is 6.58
Get precalculated fractions of proteins
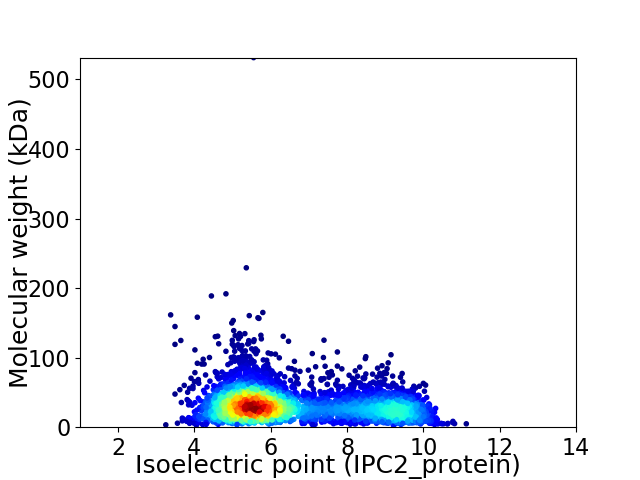
Virtual 2D-PAGE plot for 4016 proteins (isoelectric point calculated using IPC2_protein)
Get csv file with sequences according to given criteria:
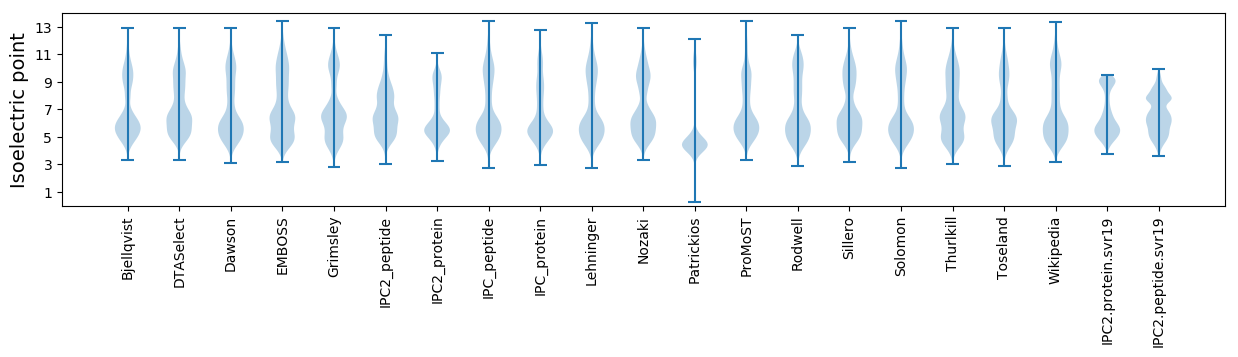
* You can choose from 21 different methods for calculating isoelectric point
Summary statistics related to proteome-wise predictions
Protein with the lowest isoelectric point:
>tr|A0A1N7QR91|A0A1N7QR91_9RHOB 3-alpha domain-containing protein OS=Gemmobacter megaterium OX=1086013 GN=SAMN05421774_12123 PE=4 SV=1
MM1 pKa = 7.47SSYY4 pKa = 11.38VLIPISIGLGLVGISAFFWALRR26 pKa = 11.84HH27 pKa = 5.92DD28 pKa = 4.06QYY30 pKa = 12.1DD31 pKa = 4.04DD32 pKa = 4.16LDD34 pKa = 3.98GAAARR39 pKa = 11.84ILIAPDD45 pKa = 3.43TPYY48 pKa = 10.94PPTDD52 pKa = 3.57NGDD55 pKa = 3.93PAWTTGCPLL64 pKa = 3.61
MM1 pKa = 7.47SSYY4 pKa = 11.38VLIPISIGLGLVGISAFFWALRR26 pKa = 11.84HH27 pKa = 5.92DD28 pKa = 4.06QYY30 pKa = 12.1DD31 pKa = 4.04DD32 pKa = 4.16LDD34 pKa = 3.98GAAARR39 pKa = 11.84ILIAPDD45 pKa = 3.43TPYY48 pKa = 10.94PPTDD52 pKa = 3.57NGDD55 pKa = 3.93PAWTTGCPLL64 pKa = 3.61
Molecular weight: 6.85 kDa
Isoelectric point according different methods:
Protein with the highest isoelectric point:
>tr|A0A1N7N9I9|A0A1N7N9I9_9RHOB DNA-binding transcriptional regulator GntR family OS=Gemmobacter megaterium OX=1086013 GN=SAMN05421774_103223 PE=4 SV=1
MM1 pKa = 7.63LSFGLVAVAAGIVARR16 pKa = 11.84FAVSRR21 pKa = 11.84GGGTGRR27 pKa = 11.84GRR29 pKa = 11.84AVRR32 pKa = 11.84VPVRR36 pKa = 11.84VQARR40 pKa = 11.84TPRR43 pKa = 11.84TPVRR47 pKa = 3.61
MM1 pKa = 7.63LSFGLVAVAAGIVARR16 pKa = 11.84FAVSRR21 pKa = 11.84GGGTGRR27 pKa = 11.84GRR29 pKa = 11.84AVRR32 pKa = 11.84VPVRR36 pKa = 11.84VQARR40 pKa = 11.84TPRR43 pKa = 11.84TPVRR47 pKa = 3.61
Molecular weight: 4.87 kDa
Isoelectric point according different methods:
Peptides (in silico digests for buttom-up proteomics)
Below you can find in silico digests of the whole proteome with Trypsin, Chymotrypsin, Trypsin+LysC, LysN, ArgC proteases suitable for different mass spec machines.| Try ESI |
 |
|---|
| ChTry ESI |
|
|---|
| ArgC ESI |
|
|---|
| LysN ESI |
|
|---|
| TryLysC ESI |
|
|---|
| Try MALDI |
|
|---|
| ChTry MALDI |
|
|---|
| ArgC MALDI |
|
|---|
| LysN MALDI |
|
|---|
| TryLysC MALDI |
|
|---|
| Try LTQ |
|
|---|
| ChTry LTQ |
|
|---|
| ArgC LTQ |
|
|---|
| LysN LTQ |
|
|---|
| TryLysC LTQ |
|
|---|
| Try MSlow |
|
|---|
| ChTry MSlow |
|
|---|
| ArgC MSlow |
|
|---|
| LysN MSlow |
|
|---|
| TryLysC MSlow |
|
|---|
| Try MShigh |
|
|---|
| ChTry MShigh |
|
|---|
| ArgC MShigh |
|
|---|
| LysN MShigh |
|
|---|
| TryLysC MShigh |
|
|---|
General Statistics
Number of major isoforms |
Number of additional isoforms |
Number of all proteins |
Number of amino acids |
Min. Seq. Length |
Max. Seq. Length |
Avg. Seq. Length |
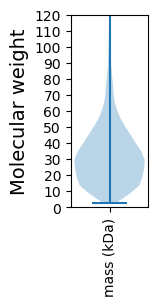
Avg. Mol. Weight |
|---|---|---|---|---|---|---|---|
0 |
1263230 |
26 |
4883 |
314.5 |
33.93 |
Amino acid frequency
Ala |
Cys |
Asp |
Glu |
Phe |
Gly |
His |
Ile |
Lys |
Leu |
|---|---|---|---|---|---|---|---|---|---|
13.437 ± 0.053 | 0.833 ± 0.012 |
5.862 ± 0.036 | 5.194 ± 0.036 |
3.49 ± 0.022 | 9.093 ± 0.042 |
2.096 ± 0.018 | 4.808 ± 0.027 |
2.51 ± 0.031 | 10.509 ± 0.055 |
Met |
Asn |
Gln |
Pro |
Arg |
Ser |
Thr |
Val |
Trp |
Tyr |
|---|---|---|---|---|---|---|---|---|---|
2.794 ± 0.02 | 2.224 ± 0.02 |
5.54 ± 0.031 | 3.167 ± 0.02 |
7.474 ± 0.038 | 4.703 ± 0.023 |
5.352 ± 0.029 | 7.432 ± 0.031 |
1.484 ± 0.016 | 1.997 ± 0.017 |
Most of the basic statistics you can see at this page can be downloaded from this CSV file
See this proteome in:

Proteome-pI is available under Creative Commons Attribution-NoDerivs license, for more details see here
| Reference: Kozlowski LP. Proteome-pI 2.0: Proteome Isoelectric Point Database Update. Nucleic Acids Res. 2021, doi: 10.1093/nar/gkab944 | Contact: Lukasz P. Kozlowski |