Spiroplasma phage SVGII3
Taxonomy: Viruses; Monodnaviria; Loebvirae; Hofneiviricota; Faserviricetes; Tubulavirales; Inoviridae; unclassified Inoviridae
Average proteome isoelectric point is 7.91
Get precalculated fractions of proteins
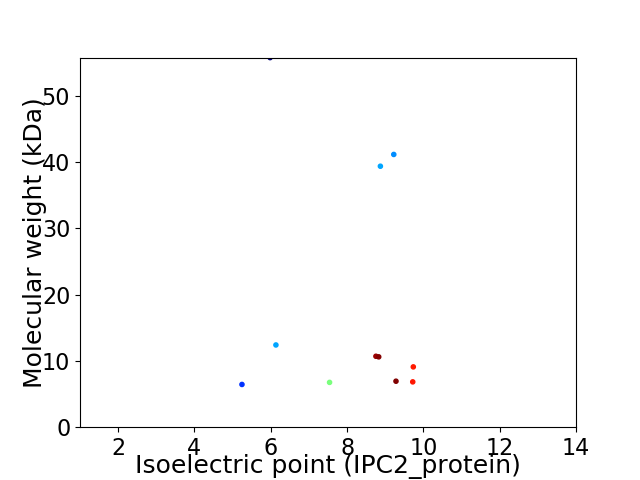
Virtual 2D-PAGE plot for 11 proteins (isoelectric point calculated using IPC2_protein)
Get csv file with sequences according to given criteria:
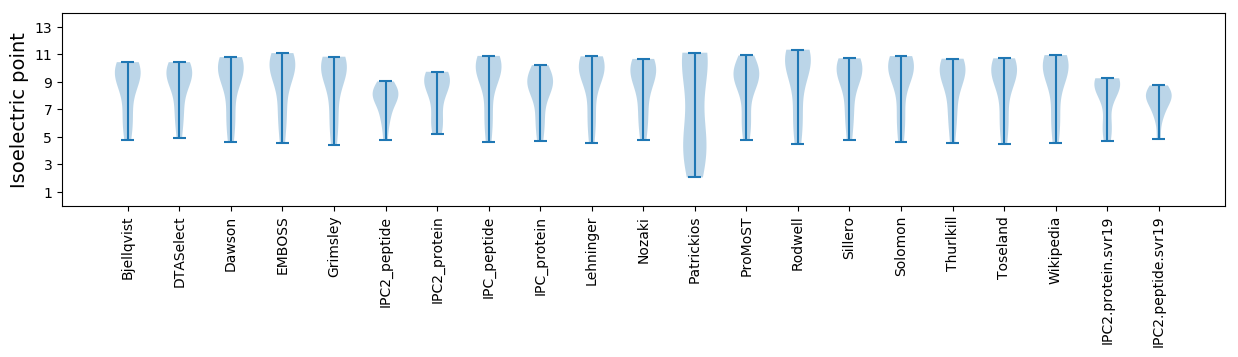
* You can choose from 21 different methods for calculating isoelectric point
Summary statistics related to proteome-wise predictions
Protein with the lowest isoelectric point:
>tr|Q3ZVF2|Q3ZVF2_9VIRU Uncharacterized protein OS=Spiroplasma phage SVGII3 OX=745349 PE=4 SV=1
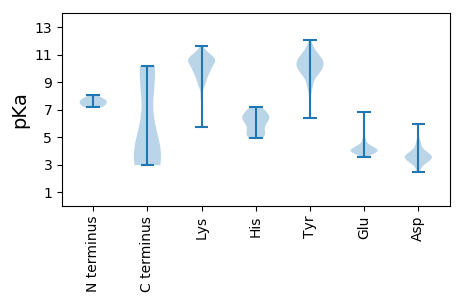
MM1 pKa = 7.53LEE3 pKa = 4.15KK4 pKa = 10.56SVFDD8 pKa = 3.56IYY10 pKa = 10.89IEE12 pKa = 3.95FMQIIFGVDD21 pKa = 3.31MPPALAYY28 pKa = 9.75ICFTLFLTFIIGVIFWIFRR47 pKa = 11.84LIFRR51 pKa = 11.84GFCC54 pKa = 3.46
MM1 pKa = 7.53LEE3 pKa = 4.15KK4 pKa = 10.56SVFDD8 pKa = 3.56IYY10 pKa = 10.89IEE12 pKa = 3.95FMQIIFGVDD21 pKa = 3.31MPPALAYY28 pKa = 9.75ICFTLFLTFIIGVIFWIFRR47 pKa = 11.84LIFRR51 pKa = 11.84GFCC54 pKa = 3.46
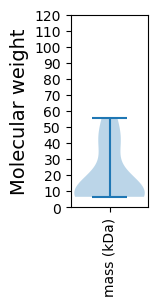
Molecular weight: 6.45 kDa
Isoelectric point according different methods:
Protein with the highest isoelectric point:
>tr|Q3ZVE9|Q3ZVE9_9VIRU Uncharacterized protein OS=Spiroplasma phage SVGII3 OX=745349 PE=4 SV=1
MM1 pKa = 7.74IKK3 pKa = 10.48LLWFFLVIGIIGSAFVANIFLASEE27 pKa = 4.02TAMATIKK34 pKa = 10.3QWFNSSNEE42 pKa = 3.93FYY44 pKa = 11.21KK45 pKa = 10.96LVANLFIIATHH56 pKa = 6.56PIFRR60 pKa = 11.84LFIAFGIMLMIIRR73 pKa = 11.84VIFVVRR79 pKa = 4.07
MM1 pKa = 7.74IKK3 pKa = 10.48LLWFFLVIGIIGSAFVANIFLASEE27 pKa = 4.02TAMATIKK34 pKa = 10.3QWFNSSNEE42 pKa = 3.93FYY44 pKa = 11.21KK45 pKa = 10.96LVANLFIIATHH56 pKa = 6.56PIFRR60 pKa = 11.84LFIAFGIMLMIIRR73 pKa = 11.84VIFVVRR79 pKa = 4.07
Molecular weight: 9.1 kDa
Isoelectric point according different methods:
Peptides (in silico digests for buttom-up proteomics)
Below you can find in silico digests of the whole proteome with Trypsin, Chymotrypsin, Trypsin+LysC, LysN, ArgC proteases suitable for different mass spec machines.| Try ESI |
 |
|---|
| ChTry ESI |
|
|---|
| ArgC ESI |
|
|---|
| LysN ESI |
|
|---|
| TryLysC ESI |
|
|---|
| Try MALDI |
|
|---|
| ChTry MALDI |
|
|---|
| ArgC MALDI |
|
|---|
| LysN MALDI |
|
|---|
| TryLysC MALDI |
|
|---|
| Try LTQ |
|
|---|
| ChTry LTQ |
|
|---|
| ArgC LTQ |
|
|---|
| LysN LTQ |
|
|---|
| TryLysC LTQ |
|
|---|
| Try MSlow |
|
|---|
| ChTry MSlow |
|
|---|
| ArgC MSlow |
|
|---|
| LysN MSlow |
|
|---|
| TryLysC MSlow |
|
|---|
| Try MShigh |
|
|---|
| ChTry MShigh |
|
|---|
| ArgC MShigh |
|
|---|
| LysN MShigh |
|
|---|
| TryLysC MShigh |
|
|---|
General Statistics
Number of major isoforms |
Number of additional isoforms |
Number of all proteins |
Number of amino acids |
Min. Seq. Length |
Max. Seq. Length |
Avg. Seq. Length |
Avg. Mol. Weight |
|---|---|---|---|---|---|---|---|
0 |
1750 |
54 |
469 |
159.1 |
18.74 |
Amino acid frequency
Ala |
Cys |
Asp |
Glu |
Phe |
Gly |
His |
Ile |
Lys |
Leu |
|---|---|---|---|---|---|---|---|---|---|
4.229 ± 0.528 | 0.686 ± 0.313 |
4.457 ± 0.583 | 4.571 ± 0.537 |
8.286 ± 1.186 | 5.029 ± 0.396 |
1.2 ± 0.255 | 10.4 ± 1.221 |
10.057 ± 0.991 | 9.429 ± 0.877 |
Met |
Asn |
Gln |
Pro |
Arg |
Ser |
Thr |
Val |
Trp |
Tyr |
|---|---|---|---|---|---|---|---|---|---|
3.086 ± 0.404 | 7.771 ± 0.873 |
2.571 ± 0.275 | 2.457 ± 0.299 |
2.857 ± 0.37 | 5.086 ± 0.578 |
3.943 ± 0.276 | 5.771 ± 0.381 |
2.229 ± 0.336 | 5.886 ± 0.8 |
Most of the basic statistics you can see at this page can be downloaded from this CSV file
See this proteome in:

Proteome-pI is available under Creative Commons Attribution-NoDerivs license, for more details see here
| Reference: Kozlowski LP. Proteome-pI 2.0: Proteome Isoelectric Point Database Update. Nucleic Acids Res. 2021, doi: 10.1093/nar/gkab944 | Contact: Lukasz P. Kozlowski |