Vibrio phage SIO-2
Taxonomy: Viruses; Duplodnaviria; Heunggongvirae; Uroviricota; Caudoviricetes; Caudovirales; Siphoviridae; unclassified Siphoviridae
Average proteome isoelectric point is 6.7
Get precalculated fractions of proteins
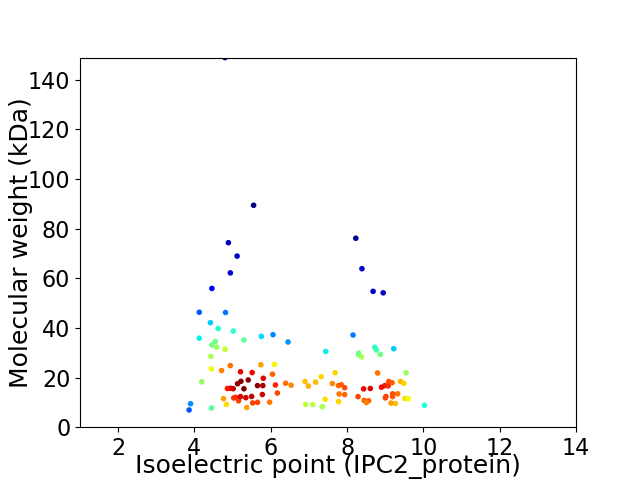
Virtual 2D-PAGE plot for 114 proteins (isoelectric point calculated using IPC2_protein)
Get csv file with sequences according to given criteria:
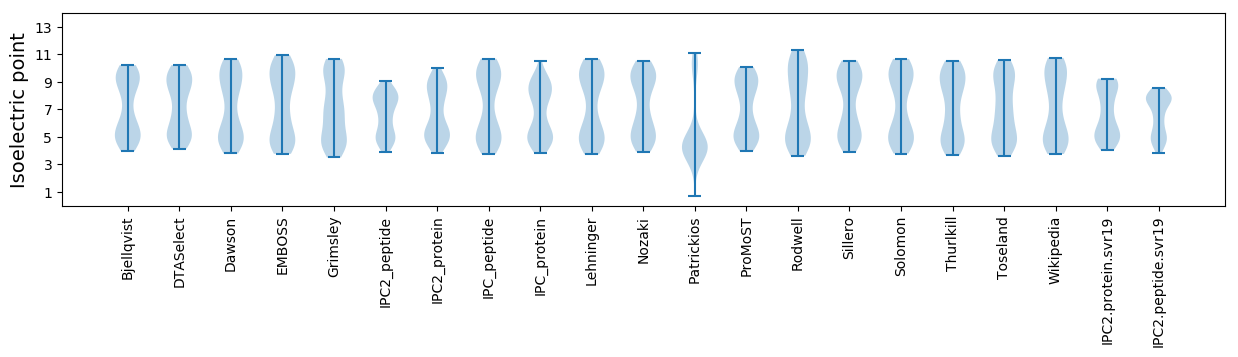
* You can choose from 21 different methods for calculating isoelectric point
Summary statistics related to proteome-wise predictions
Protein with the lowest isoelectric point:
>tr|G8CTC0|G8CTC0_9CAUD Uncharacterized protein OS=Vibrio phage SIO-2 OX=700512 GN=VPEG_00050 PE=4 SV=1
MM1 pKa = 7.32TKK3 pKa = 10.36VIYY6 pKa = 10.02DD7 pKa = 3.47YY8 pKa = 11.41QYY10 pKa = 11.25VNKK13 pKa = 10.07ANPFHH18 pKa = 6.52FVKK21 pKa = 10.84LSLDD25 pKa = 3.42GDD27 pKa = 4.11FVEE30 pKa = 5.96VGAEE34 pKa = 3.95DD35 pKa = 4.11GEE37 pKa = 4.58EE38 pKa = 3.98VSDD41 pKa = 5.98AILKK45 pKa = 10.9DD46 pKa = 3.6MVNMYY51 pKa = 10.61DD52 pKa = 3.06VDD54 pKa = 3.86GFSIEE59 pKa = 4.34DD60 pKa = 3.43LL61 pKa = 4.02
MM1 pKa = 7.32TKK3 pKa = 10.36VIYY6 pKa = 10.02DD7 pKa = 3.47YY8 pKa = 11.41QYY10 pKa = 11.25VNKK13 pKa = 10.07ANPFHH18 pKa = 6.52FVKK21 pKa = 10.84LSLDD25 pKa = 3.42GDD27 pKa = 4.11FVEE30 pKa = 5.96VGAEE34 pKa = 3.95DD35 pKa = 4.11GEE37 pKa = 4.58EE38 pKa = 3.98VSDD41 pKa = 5.98AILKK45 pKa = 10.9DD46 pKa = 3.6MVNMYY51 pKa = 10.61DD52 pKa = 3.06VDD54 pKa = 3.86GFSIEE59 pKa = 4.34DD60 pKa = 3.43LL61 pKa = 4.02
Molecular weight: 6.94 kDa
Isoelectric point according different methods:
Protein with the highest isoelectric point:
>tr|G8CT95|G8CT95_9CAUD Uncharacterized protein OS=Vibrio phage SIO-2 OX=700512 GN=VPEG_00025 PE=4 SV=1
MM1 pKa = 7.61IFFITQFSIAFVTIFLRR18 pKa = 11.84GVQTQNVVQGNYY30 pKa = 9.65KK31 pKa = 10.49GAFLTSIGMSVANVAFIGMVAVDD54 pKa = 4.09PWASFIPVALGAATGITSSMYY75 pKa = 9.53YY76 pKa = 10.1KK77 pKa = 10.23RR78 pKa = 11.84RR79 pKa = 11.84NMM81 pKa = 3.66
MM1 pKa = 7.61IFFITQFSIAFVTIFLRR18 pKa = 11.84GVQTQNVVQGNYY30 pKa = 9.65KK31 pKa = 10.49GAFLTSIGMSVANVAFIGMVAVDD54 pKa = 4.09PWASFIPVALGAATGITSSMYY75 pKa = 9.53YY76 pKa = 10.1KK77 pKa = 10.23RR78 pKa = 11.84RR79 pKa = 11.84NMM81 pKa = 3.66
Molecular weight: 8.84 kDa
Isoelectric point according different methods:
Peptides (in silico digests for buttom-up proteomics)
Below you can find in silico digests of the whole proteome with Trypsin, Chymotrypsin, Trypsin+LysC, LysN, ArgC proteases suitable for different mass spec machines.| Try ESI |
 |
|---|
| ChTry ESI |
|
|---|
| ArgC ESI |
|
|---|
| LysN ESI |
|
|---|
| TryLysC ESI |
|
|---|
| Try MALDI |
|
|---|
| ChTry MALDI |
|
|---|
| ArgC MALDI |
|
|---|
| LysN MALDI |
|
|---|
| TryLysC MALDI |
|
|---|
| Try LTQ |
|
|---|
| ChTry LTQ |
|
|---|
| ArgC LTQ |
|
|---|
| LysN LTQ |
|
|---|
| TryLysC LTQ |
|
|---|
| Try MSlow |
|
|---|
| ChTry MSlow |
|
|---|
| ArgC MSlow |
|
|---|
| LysN MSlow |
|
|---|
| TryLysC MSlow |
|
|---|
| Try MShigh |
|
|---|
| ChTry MShigh |
|
|---|
| ArgC MShigh |
|
|---|
| LysN MShigh |
|
|---|
| TryLysC MShigh |
|
|---|
General Statistics
Number of major isoforms |
Number of additional isoforms |
Number of all proteins |
Number of amino acids |
Min. Seq. Length |
Max. Seq. Length |
Avg. Seq. Length |
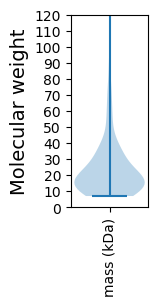
Avg. Mol. Weight |
|---|---|---|---|---|---|---|---|
0 |
24890 |
61 |
1377 |
218.3 |
24.4 |
Amino acid frequency
Ala |
Cys |
Asp |
Glu |
Phe |
Gly |
His |
Ile |
Lys |
Leu |
|---|---|---|---|---|---|---|---|---|---|
8.236 ± 0.378 | 1.117 ± 0.102 |
6.452 ± 0.164 | 6.545 ± 0.224 |
3.6 ± 0.15 | 5.962 ± 0.172 |
2.005 ± 0.14 | 5.958 ± 0.147 |
6.802 ± 0.259 | 9.462 ± 0.234 |
Met |
Asn |
Gln |
Pro |
Arg |
Ser |
Thr |
Val |
Trp |
Tyr |
|---|---|---|---|---|---|---|---|---|---|
2.041 ± 0.101 | 5.115 ± 0.164 |
3.64 ± 0.172 | 3.407 ± 0.158 |
5.376 ± 0.21 | 6.734 ± 0.209 |
6.227 ± 0.175 | 6.922 ± 0.185 |
0.759 ± 0.073 | 3.64 ± 0.163 |
Most of the basic statistics you can see at this page can be downloaded from this CSV file
See this proteome in:

Proteome-pI is available under Creative Commons Attribution-NoDerivs license, for more details see here
| Reference: Kozlowski LP. Proteome-pI 2.0: Proteome Isoelectric Point Database Update. Nucleic Acids Res. 2021, doi: 10.1093/nar/gkab944 | Contact: Lukasz P. Kozlowski |