Clostridium sp. CAG:343
Taxonomy: cellular organisms; Bacteria; Terrabacteria group; Firmicutes; Clostridia; Eubacteriales; Clostridiaceae; Clostridium; environmental samples
Average proteome isoelectric point is 6.78
Get precalculated fractions of proteins
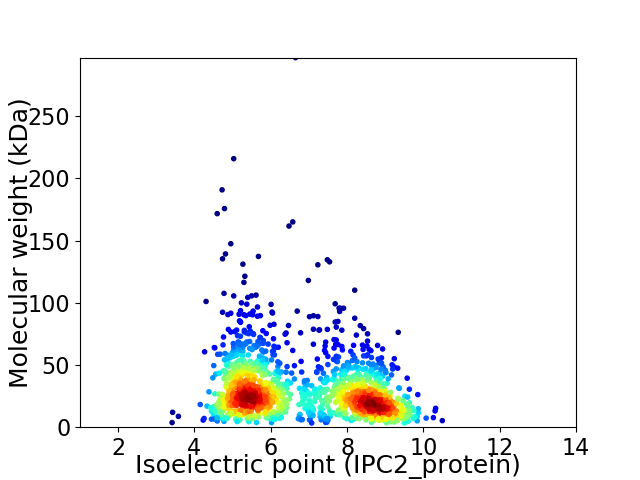
Virtual 2D-PAGE plot for 1443 proteins (isoelectric point calculated using IPC2_protein)
Get csv file with sequences according to given criteria:
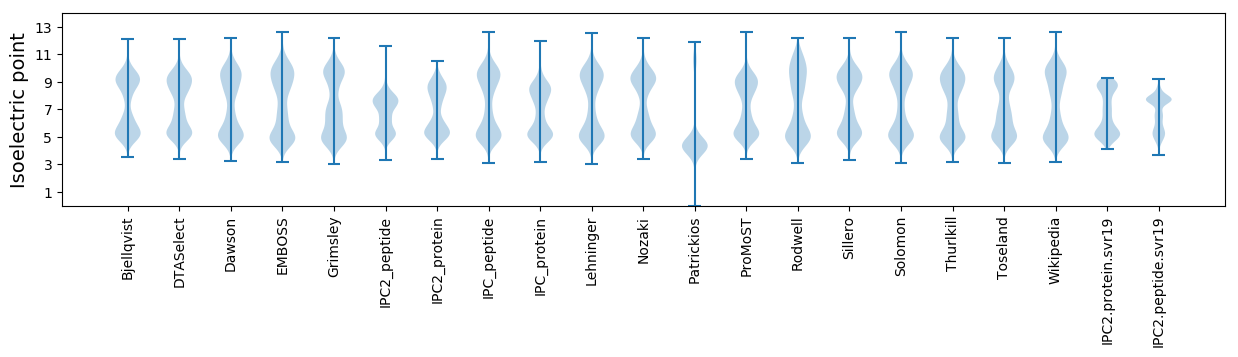
* You can choose from 21 different methods for calculating isoelectric point
Summary statistics related to proteome-wise predictions
Protein with the lowest isoelectric point:
>tr|R6NCN6|R6NCN6_9CLOT Uncharacterized protein OS=Clostridium sp. CAG:343 OX=1262796 GN=BN615_00457 PE=4 SV=1
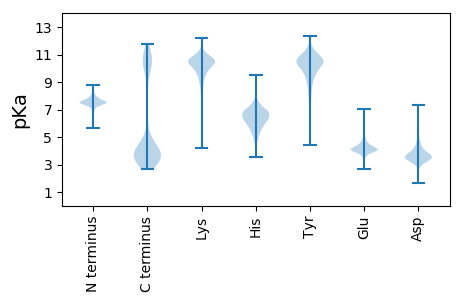
MM1 pKa = 7.8AYY3 pKa = 9.72KK4 pKa = 9.08ITEE7 pKa = 3.99KK8 pKa = 10.69CISCGACAVEE18 pKa = 4.94CPVGCISQGEE28 pKa = 4.3DD29 pKa = 3.19KK30 pKa = 10.96FVIDD34 pKa = 4.65ASACISCGTCAGVCPVEE51 pKa = 4.41APEE54 pKa = 4.25EE55 pKa = 4.14EE56 pKa = 4.37
MM1 pKa = 7.8AYY3 pKa = 9.72KK4 pKa = 9.08ITEE7 pKa = 3.99KK8 pKa = 10.69CISCGACAVEE18 pKa = 4.94CPVGCISQGEE28 pKa = 4.3DD29 pKa = 3.19KK30 pKa = 10.96FVIDD34 pKa = 4.65ASACISCGTCAGVCPVEE51 pKa = 4.41APEE54 pKa = 4.25EE55 pKa = 4.14EE56 pKa = 4.37
Molecular weight: 5.72 kDa
Isoelectric point according different methods:
Protein with the highest isoelectric point:
>tr|R6NDW7|R6NDW7_9CLOT DUF2179 domain-containing protein OS=Clostridium sp. CAG:343 OX=1262796 GN=BN615_00797 PE=4 SV=1
MM1 pKa = 6.81YY2 pKa = 10.44LKK4 pKa = 10.5RR5 pKa = 11.84LEE7 pKa = 4.12LQGFKK12 pKa = 10.84SFADD16 pKa = 3.44KK17 pKa = 10.68TILEE21 pKa = 4.32FMPGITSVIGPNGSGKK37 pKa = 10.98SNISDD42 pKa = 3.98SIRR45 pKa = 11.84WVLRR49 pKa = 11.84RR50 pKa = 11.84AKK52 pKa = 10.64HH53 pKa = 6.0EE54 pKa = 4.24IIKK57 pKa = 9.59RR58 pKa = 11.84NKK60 pKa = 8.64VIRR63 pKa = 11.84HH64 pKa = 4.81YY65 pKa = 10.75FCRR68 pKa = 11.84NPKK71 pKa = 9.86
MM1 pKa = 6.81YY2 pKa = 10.44LKK4 pKa = 10.5RR5 pKa = 11.84LEE7 pKa = 4.12LQGFKK12 pKa = 10.84SFADD16 pKa = 3.44KK17 pKa = 10.68TILEE21 pKa = 4.32FMPGITSVIGPNGSGKK37 pKa = 10.98SNISDD42 pKa = 3.98SIRR45 pKa = 11.84WVLRR49 pKa = 11.84RR50 pKa = 11.84AKK52 pKa = 10.64HH53 pKa = 6.0EE54 pKa = 4.24IIKK57 pKa = 9.59RR58 pKa = 11.84NKK60 pKa = 8.64VIRR63 pKa = 11.84HH64 pKa = 4.81YY65 pKa = 10.75FCRR68 pKa = 11.84NPKK71 pKa = 9.86
Molecular weight: 8.29 kDa
Isoelectric point according different methods:
Peptides (in silico digests for buttom-up proteomics)
Below you can find in silico digests of the whole proteome with Trypsin, Chymotrypsin, Trypsin+LysC, LysN, ArgC proteases suitable for different mass spec machines.| Try ESI |
 |
|---|
| ChTry ESI |
|
|---|
| ArgC ESI |
|
|---|
| LysN ESI |
|
|---|
| TryLysC ESI |
|
|---|
| Try MALDI |
|
|---|
| ChTry MALDI |
|
|---|
| ArgC MALDI |
|
|---|
| LysN MALDI |
|
|---|
| TryLysC MALDI |
|
|---|
| Try LTQ |
|
|---|
| ChTry LTQ |
|
|---|
| ArgC LTQ |
|
|---|
| LysN LTQ |
|
|---|
| TryLysC LTQ |
|
|---|
| Try MSlow |
|
|---|
| ChTry MSlow |
|
|---|
| ArgC MSlow |
|
|---|
| LysN MSlow |
|
|---|
| TryLysC MSlow |
|
|---|
| Try MShigh |
|
|---|
| ChTry MShigh |
|
|---|
| ArgC MShigh |
|
|---|
| LysN MShigh |
|
|---|
| TryLysC MShigh |
|
|---|
General Statistics
Number of major isoforms |
Number of additional isoforms |
Number of all proteins |
Number of amino acids |
Min. Seq. Length |
Max. Seq. Length |
Avg. Seq. Length |
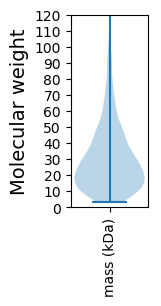
Avg. Mol. Weight |
|---|---|---|---|---|---|---|---|
0 |
406588 |
29 |
2556 |
281.8 |
32.21 |
Amino acid frequency
Ala |
Cys |
Asp |
Glu |
Phe |
Gly |
His |
Ile |
Lys |
Leu |
|---|---|---|---|---|---|---|---|---|---|
4.82 ± 0.053 | 1.106 ± 0.024 |
5.378 ± 0.054 | 8.547 ± 0.077 |
3.941 ± 0.056 | 5.607 ± 0.059 |
1.219 ± 0.024 | 10.514 ± 0.085 |
10.555 ± 0.073 | 8.275 ± 0.063 |
Met |
Asn |
Gln |
Pro |
Arg |
Ser |
Thr |
Val |
Trp |
Tyr |
|---|---|---|---|---|---|---|---|---|---|
2.412 ± 0.033 | 7.041 ± 0.071 |
2.495 ± 0.037 | 2.851 ± 0.034 |
3.257 ± 0.048 | 5.688 ± 0.056 |
5.332 ± 0.055 | 5.822 ± 0.047 |
0.631 ± 0.02 | 4.508 ± 0.053 |
Most of the basic statistics you can see at this page can be downloaded from this CSV file
See this proteome in:

Proteome-pI is available under Creative Commons Attribution-NoDerivs license, for more details see here
| Reference: Kozlowski LP. Proteome-pI 2.0: Proteome Isoelectric Point Database Update. Nucleic Acids Res. 2021, doi: 10.1093/nar/gkab944 | Contact: Lukasz P. Kozlowski |