Acidianus bottle-shaped virus 3
Taxonomy: Viruses; Ampullaviridae; Bottigliavirus; Bottigliavirus ABV3
Average proteome isoelectric point is 6.17
Get precalculated fractions of proteins
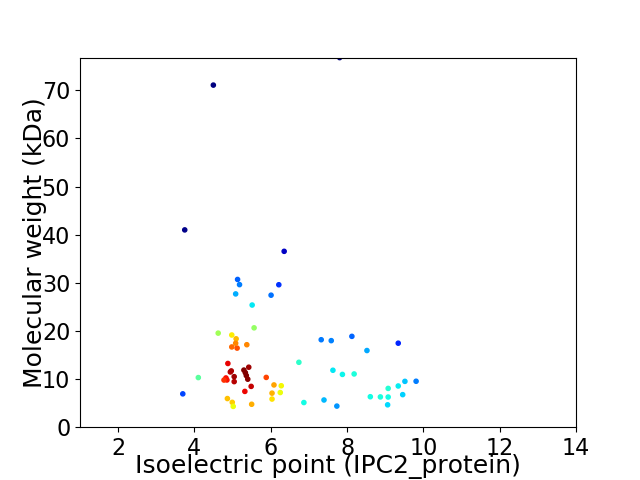
Virtual 2D-PAGE plot for 66 proteins (isoelectric point calculated using IPC2_protein)
Get csv file with sequences according to given criteria:
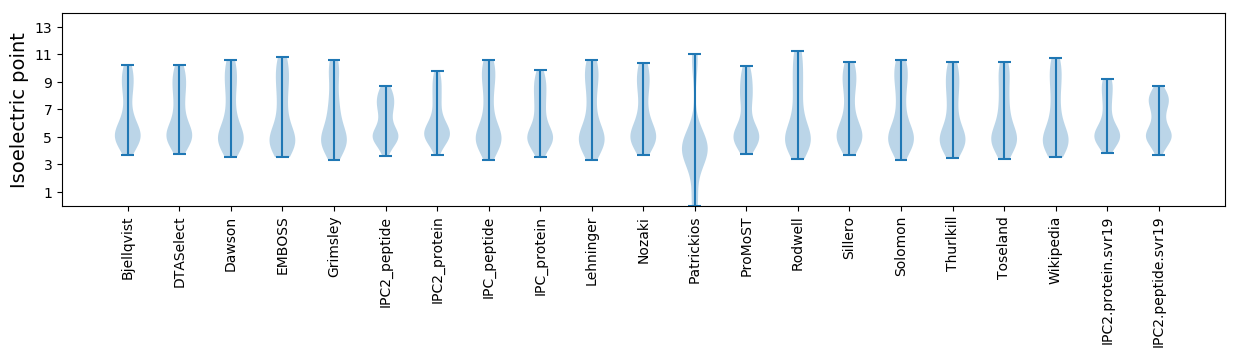
* You can choose from 21 different methods for calculating isoelectric point
Summary statistics related to proteome-wise predictions
Protein with the lowest isoelectric point:
>tr|A0A0N9P9A0|A0A0N9P9A0_9VIRU Uncharacterized protein OS=Acidianus bottle-shaped virus 3 OX=1732174 PE=4 SV=1
MM1 pKa = 8.04LDD3 pKa = 3.68TILFIAGGLLFSNTFMGVIIYY24 pKa = 10.01IEE26 pKa = 4.19IKK28 pKa = 9.68KK29 pKa = 9.19MEE31 pKa = 4.21YY32 pKa = 10.35VFEE35 pKa = 4.53QILQGISTNNQNDD48 pKa = 3.75EE49 pKa = 4.15EE50 pKa = 6.23DD51 pKa = 4.04YY52 pKa = 11.57DD53 pKa = 4.77PDD55 pKa = 4.0TNSYY59 pKa = 9.61II60 pKa = 3.9
MM1 pKa = 8.04LDD3 pKa = 3.68TILFIAGGLLFSNTFMGVIIYY24 pKa = 10.01IEE26 pKa = 4.19IKK28 pKa = 9.68KK29 pKa = 9.19MEE31 pKa = 4.21YY32 pKa = 10.35VFEE35 pKa = 4.53QILQGISTNNQNDD48 pKa = 3.75EE49 pKa = 4.15EE50 pKa = 6.23DD51 pKa = 4.04YY52 pKa = 11.57DD53 pKa = 4.77PDD55 pKa = 4.0TNSYY59 pKa = 9.61II60 pKa = 3.9
Molecular weight: 6.93 kDa
Isoelectric point according different methods:
Protein with the highest isoelectric point:
>tr|A0A0N9NWB6|A0A0N9NWB6_9VIRU Uncharacterized protein OS=Acidianus bottle-shaped virus 3 OX=1732174 PE=4 SV=1
MM1 pKa = 7.73KK2 pKa = 10.36SLRR5 pKa = 11.84KK6 pKa = 9.69VKK8 pKa = 10.48RR9 pKa = 11.84KK10 pKa = 10.16LKK12 pKa = 10.79DD13 pKa = 2.89KK14 pKa = 11.21GITIKK19 pKa = 10.47IKK21 pKa = 10.25PDD23 pKa = 3.2TLFEE27 pKa = 4.0FLFAFFIGNLVLTKK41 pKa = 10.95NFIQSLYY48 pKa = 7.48STGYY52 pKa = 8.8AFVYY56 pKa = 10.06VLIGTLVLFGVIVGILFFFYY76 pKa = 11.12LLGSLLRR83 pKa = 4.87
MM1 pKa = 7.73KK2 pKa = 10.36SLRR5 pKa = 11.84KK6 pKa = 9.69VKK8 pKa = 10.48RR9 pKa = 11.84KK10 pKa = 10.16LKK12 pKa = 10.79DD13 pKa = 2.89KK14 pKa = 11.21GITIKK19 pKa = 10.47IKK21 pKa = 10.25PDD23 pKa = 3.2TLFEE27 pKa = 4.0FLFAFFIGNLVLTKK41 pKa = 10.95NFIQSLYY48 pKa = 7.48STGYY52 pKa = 8.8AFVYY56 pKa = 10.06VLIGTLVLFGVIVGILFFFYY76 pKa = 11.12LLGSLLRR83 pKa = 4.87
Molecular weight: 9.55 kDa
Isoelectric point according different methods:
Peptides (in silico digests for buttom-up proteomics)
Below you can find in silico digests of the whole proteome with Trypsin, Chymotrypsin, Trypsin+LysC, LysN, ArgC proteases suitable for different mass spec machines.| Try ESI |
 |
|---|
| ChTry ESI |
|
|---|
| ArgC ESI |
|
|---|
| LysN ESI |
|
|---|
| TryLysC ESI |
|
|---|
| Try MALDI |
|
|---|
| ChTry MALDI |
|
|---|
| ArgC MALDI |
|
|---|
| LysN MALDI |
|
|---|
| TryLysC MALDI |
|
|---|
| Try LTQ |
|
|---|
| ChTry LTQ |
|
|---|
| ArgC LTQ |
|
|---|
| LysN LTQ |
|
|---|
| TryLysC LTQ |
|
|---|
| Try MSlow |
|
|---|
| ChTry MSlow |
|
|---|
| ArgC MSlow |
|
|---|
| LysN MSlow |
|
|---|
| TryLysC MSlow |
|
|---|
| Try MShigh |
|
|---|
| ChTry MShigh |
|
|---|
| ArgC MShigh |
|
|---|
| LysN MShigh |
|
|---|
| TryLysC MShigh |
|
|---|
General Statistics
Number of major isoforms |
Number of additional isoforms |
Number of all proteins |
Number of amino acids |
Min. Seq. Length |
Max. Seq. Length |
Avg. Seq. Length |
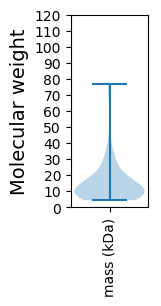
Avg. Mol. Weight |
|---|---|---|---|---|---|---|---|
0 |
8675 |
38 |
662 |
131.4 |
15.18 |
Amino acid frequency
Ala |
Cys |
Asp |
Glu |
Phe |
Gly |
His |
Ile |
Lys |
Leu |
|---|---|---|---|---|---|---|---|---|---|
4.104 ± 0.259 | 1.568 ± 0.29 |
5.037 ± 0.322 | 7.643 ± 0.424 |
5.153 ± 0.293 | 3.988 ± 0.319 |
1.383 ± 0.156 | 9.245 ± 0.291 |
8.622 ± 0.649 | 11.159 ± 0.454 |
Met |
Asn |
Gln |
Pro |
Arg |
Ser |
Thr |
Val |
Trp |
Tyr |
|---|---|---|---|---|---|---|---|---|---|
2.225 ± 0.216 | 5.695 ± 0.333 |
4.161 ± 0.439 | 3.47 ± 0.336 |
2.767 ± 0.252 | 6.006 ± 0.367 |
5.037 ± 0.181 | 6.571 ± 0.3 |
0.715 ± 0.102 | 5.452 ± 0.271 |
Most of the basic statistics you can see at this page can be downloaded from this CSV file
See this proteome in:

Proteome-pI is available under Creative Commons Attribution-NoDerivs license, for more details see here
| Reference: Kozlowski LP. Proteome-pI 2.0: Proteome Isoelectric Point Database Update. Nucleic Acids Res. 2021, doi: 10.1093/nar/gkab944 | Contact: Lukasz P. Kozlowski |