Simian immunodeficiency virus (isolate CPZ GAB1) (SIV-cpz) (Chimpanzee immunodeficiency virus)
Taxonomy: Viruses; Riboviria; Pararnavirae; Artverviricota; Revtraviricetes; Ortervirales; Retroviridae; Orthoretrovirinae; Lentivirus; Simian immunodeficiency virus; Simian immunodeficiency virus - cpz
Average proteome isoelectric point is 7.62
Get precalculated fractions of proteins
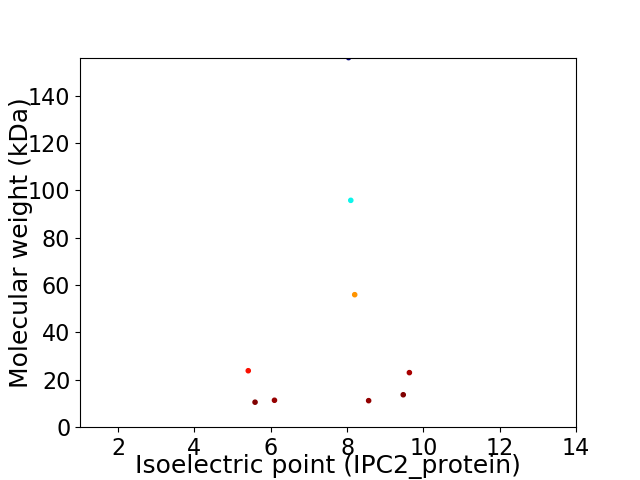
Virtual 2D-PAGE plot for 9 proteins (isoelectric point calculated using IPC2_protein)
Get csv file with sequences according to given criteria:
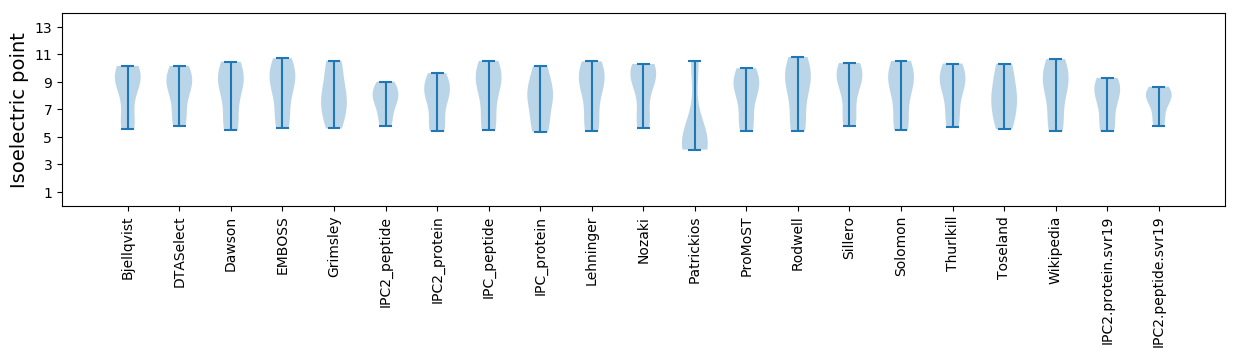
* You can choose from 21 different methods for calculating isoelectric point
Summary statistics related to proteome-wise predictions
Protein with the lowest isoelectric point:
>sp|P17664|NEF_SIVCZ Protein Nef OS=Simian immunodeficiency virus (isolate CPZ GAB1) OX=402771 GN=nef PE=3 SV=3
MM1 pKa = 6.24GTKK4 pKa = 8.93WSKK7 pKa = 10.74SSLVGWPEE15 pKa = 3.24VRR17 pKa = 11.84RR18 pKa = 11.84RR19 pKa = 11.84IRR21 pKa = 11.84EE22 pKa = 3.91APTAAEE28 pKa = 4.39GVGEE32 pKa = 4.05VSKK35 pKa = 11.08DD36 pKa = 3.72LEE38 pKa = 3.98RR39 pKa = 11.84HH40 pKa = 4.8GAITSRR46 pKa = 11.84NTPEE50 pKa = 4.05TNQTLAWLEE59 pKa = 3.87EE60 pKa = 3.98MDD62 pKa = 3.87NEE64 pKa = 4.29EE65 pKa = 3.55VGFPVRR71 pKa = 11.84PQVPTRR77 pKa = 11.84PMTYY81 pKa = 9.89KK82 pKa = 10.62AAFDD86 pKa = 3.95LSHH89 pKa = 6.79FLKK92 pKa = 10.76EE93 pKa = 4.12KK94 pKa = 10.73GGLEE98 pKa = 3.75GLVYY102 pKa = 10.33SRR104 pKa = 11.84RR105 pKa = 11.84RR106 pKa = 11.84QEE108 pKa = 5.63ILDD111 pKa = 3.24LWVYY115 pKa = 8.03HH116 pKa = 5.36TQGFFPDD123 pKa = 3.35WQNYY127 pKa = 4.89TTGPGTRR134 pKa = 11.84FPLCFGWCFKK144 pKa = 10.56LVPLTEE150 pKa = 4.3EE151 pKa = 3.88QVEE154 pKa = 4.27QANEE158 pKa = 3.88GDD160 pKa = 4.34NNCLLHH166 pKa = 6.67PICQHH171 pKa = 5.66GMEE174 pKa = 5.29DD175 pKa = 3.5EE176 pKa = 4.48DD177 pKa = 5.66KK178 pKa = 11.04EE179 pKa = 4.48VLVWRR184 pKa = 11.84FDD186 pKa = 3.14SRR188 pKa = 11.84LALRR192 pKa = 11.84HH193 pKa = 5.68IARR196 pKa = 11.84EE197 pKa = 3.91QHH199 pKa = 5.58PEE201 pKa = 3.94YY202 pKa = 11.15YY203 pKa = 10.33KK204 pKa = 10.91DD205 pKa = 3.25
MM1 pKa = 6.24GTKK4 pKa = 8.93WSKK7 pKa = 10.74SSLVGWPEE15 pKa = 3.24VRR17 pKa = 11.84RR18 pKa = 11.84RR19 pKa = 11.84IRR21 pKa = 11.84EE22 pKa = 3.91APTAAEE28 pKa = 4.39GVGEE32 pKa = 4.05VSKK35 pKa = 11.08DD36 pKa = 3.72LEE38 pKa = 3.98RR39 pKa = 11.84HH40 pKa = 4.8GAITSRR46 pKa = 11.84NTPEE50 pKa = 4.05TNQTLAWLEE59 pKa = 3.87EE60 pKa = 3.98MDD62 pKa = 3.87NEE64 pKa = 4.29EE65 pKa = 3.55VGFPVRR71 pKa = 11.84PQVPTRR77 pKa = 11.84PMTYY81 pKa = 9.89KK82 pKa = 10.62AAFDD86 pKa = 3.95LSHH89 pKa = 6.79FLKK92 pKa = 10.76EE93 pKa = 4.12KK94 pKa = 10.73GGLEE98 pKa = 3.75GLVYY102 pKa = 10.33SRR104 pKa = 11.84RR105 pKa = 11.84RR106 pKa = 11.84QEE108 pKa = 5.63ILDD111 pKa = 3.24LWVYY115 pKa = 8.03HH116 pKa = 5.36TQGFFPDD123 pKa = 3.35WQNYY127 pKa = 4.89TTGPGTRR134 pKa = 11.84FPLCFGWCFKK144 pKa = 10.56LVPLTEE150 pKa = 4.3EE151 pKa = 3.88QVEE154 pKa = 4.27QANEE158 pKa = 3.88GDD160 pKa = 4.34NNCLLHH166 pKa = 6.67PICQHH171 pKa = 5.66GMEE174 pKa = 5.29DD175 pKa = 3.5EE176 pKa = 4.48DD177 pKa = 5.66KK178 pKa = 11.04EE179 pKa = 4.48VLVWRR184 pKa = 11.84FDD186 pKa = 3.14SRR188 pKa = 11.84LALRR192 pKa = 11.84HH193 pKa = 5.68IARR196 pKa = 11.84EE197 pKa = 3.91QHH199 pKa = 5.58PEE201 pKa = 3.94YY202 pKa = 11.15YY203 pKa = 10.33KK204 pKa = 10.91DD205 pKa = 3.25
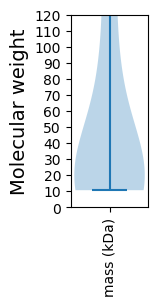
Molecular weight: 23.85 kDa
Isoelectric point according different methods:
Protein with the highest isoelectric point:
>sp|P17285|TAT_SIVCZ Protein Tat OS=Simian immunodeficiency virus (isolate CPZ GAB1) OX=402771 GN=tat PE=3 SV=1
MM1 pKa = 7.3EE2 pKa = 5.21NRR4 pKa = 11.84WQVMIVWQVDD14 pKa = 3.01RR15 pKa = 11.84MRR17 pKa = 11.84IKK19 pKa = 9.27TWNSLVKK26 pKa = 8.92YY27 pKa = 10.13HH28 pKa = 7.56IYY30 pKa = 9.99RR31 pKa = 11.84SKK33 pKa = 10.72KK34 pKa = 8.49ARR36 pKa = 11.84GWFYY40 pKa = 10.41RR41 pKa = 11.84HH42 pKa = 6.71HH43 pKa = 7.12YY44 pKa = 9.52DD45 pKa = 3.87HH46 pKa = 7.8PNPKK50 pKa = 9.36VASEE54 pKa = 3.35IHH56 pKa = 6.27IPFRR60 pKa = 11.84DD61 pKa = 3.73YY62 pKa = 11.66SKK64 pKa = 11.26LIVTTYY70 pKa = 8.9WALSPGEE77 pKa = 4.22RR78 pKa = 11.84AWHH81 pKa = 6.31LGHH84 pKa = 6.6GVSIQWRR91 pKa = 11.84LGSYY95 pKa = 7.48VTQVDD100 pKa = 4.19PFTADD105 pKa = 3.5RR106 pKa = 11.84LIHH109 pKa = 6.05SQYY112 pKa = 10.35FDD114 pKa = 4.16CFAEE118 pKa = 4.27TAIRR122 pKa = 11.84RR123 pKa = 11.84AILGQLVAPRR133 pKa = 11.84CEE135 pKa = 4.1YY136 pKa = 10.98KK137 pKa = 10.34EE138 pKa = 3.78GHH140 pKa = 5.91RR141 pKa = 11.84QVGSLQFLALKK152 pKa = 10.6ALISEE157 pKa = 4.38RR158 pKa = 11.84RR159 pKa = 11.84HH160 pKa = 5.72RR161 pKa = 11.84PPLPSVAKK169 pKa = 9.23LTEE172 pKa = 4.24DD173 pKa = 2.93RR174 pKa = 11.84WNKK177 pKa = 8.12HH178 pKa = 4.28QRR180 pKa = 11.84TKK182 pKa = 10.4VHH184 pKa = 5.98QEE186 pKa = 3.1NLTRR190 pKa = 11.84NGHH193 pKa = 5.22
MM1 pKa = 7.3EE2 pKa = 5.21NRR4 pKa = 11.84WQVMIVWQVDD14 pKa = 3.01RR15 pKa = 11.84MRR17 pKa = 11.84IKK19 pKa = 9.27TWNSLVKK26 pKa = 8.92YY27 pKa = 10.13HH28 pKa = 7.56IYY30 pKa = 9.99RR31 pKa = 11.84SKK33 pKa = 10.72KK34 pKa = 8.49ARR36 pKa = 11.84GWFYY40 pKa = 10.41RR41 pKa = 11.84HH42 pKa = 6.71HH43 pKa = 7.12YY44 pKa = 9.52DD45 pKa = 3.87HH46 pKa = 7.8PNPKK50 pKa = 9.36VASEE54 pKa = 3.35IHH56 pKa = 6.27IPFRR60 pKa = 11.84DD61 pKa = 3.73YY62 pKa = 11.66SKK64 pKa = 11.26LIVTTYY70 pKa = 8.9WALSPGEE77 pKa = 4.22RR78 pKa = 11.84AWHH81 pKa = 6.31LGHH84 pKa = 6.6GVSIQWRR91 pKa = 11.84LGSYY95 pKa = 7.48VTQVDD100 pKa = 4.19PFTADD105 pKa = 3.5RR106 pKa = 11.84LIHH109 pKa = 6.05SQYY112 pKa = 10.35FDD114 pKa = 4.16CFAEE118 pKa = 4.27TAIRR122 pKa = 11.84RR123 pKa = 11.84AILGQLVAPRR133 pKa = 11.84CEE135 pKa = 4.1YY136 pKa = 10.98KK137 pKa = 10.34EE138 pKa = 3.78GHH140 pKa = 5.91RR141 pKa = 11.84QVGSLQFLALKK152 pKa = 10.6ALISEE157 pKa = 4.38RR158 pKa = 11.84RR159 pKa = 11.84HH160 pKa = 5.72RR161 pKa = 11.84PPLPSVAKK169 pKa = 9.23LTEE172 pKa = 4.24DD173 pKa = 2.93RR174 pKa = 11.84WNKK177 pKa = 8.12HH178 pKa = 4.28QRR180 pKa = 11.84TKK182 pKa = 10.4VHH184 pKa = 5.98QEE186 pKa = 3.1NLTRR190 pKa = 11.84NGHH193 pKa = 5.22
Molecular weight: 23.05 kDa
Isoelectric point according different methods:
Peptides (in silico digests for buttom-up proteomics)
Below you can find in silico digests of the whole proteome with Trypsin, Chymotrypsin, Trypsin+LysC, LysN, ArgC proteases suitable for different mass spec machines.| Try ESI |
 |
|---|
| ChTry ESI |
|
|---|
| ArgC ESI |
|
|---|
| LysN ESI |
|
|---|
| TryLysC ESI |
|
|---|
| Try MALDI |
|
|---|
| ChTry MALDI |
|
|---|
| ArgC MALDI |
|
|---|
| LysN MALDI |
|
|---|
| TryLysC MALDI |
|
|---|
| Try LTQ |
|
|---|
| ChTry LTQ |
|
|---|
| ArgC LTQ |
|
|---|
| LysN LTQ |
|
|---|
| TryLysC LTQ |
|
|---|
| Try MSlow |
|
|---|
| ChTry MSlow |
|
|---|
| ArgC MSlow |
|
|---|
| LysN MSlow |
|
|---|
| TryLysC MSlow |
|
|---|
| Try MShigh |
|
|---|
| ChTry MShigh |
|
|---|
| ArgC MShigh |
|
|---|
| LysN MShigh |
|
|---|
| TryLysC MShigh |
|
|---|
General Statistics
Number of major isoforms |
Number of additional isoforms |
Number of all proteins |
Number of amino acids |
Min. Seq. Length |
Max. Seq. Length |
Avg. Seq. Length |
Avg. Mol. Weight |
|---|---|---|---|---|---|---|---|
0 |
3552 |
88 |
1384 |
394.7 |
44.62 |
Amino acid frequency
Ala |
Cys |
Asp |
Glu |
Phe |
Gly |
His |
Ile |
Lys |
Leu |
|---|---|---|---|---|---|---|---|---|---|
6.363 ± 0.377 | 2.083 ± 0.342 |
4.026 ± 0.252 | 6.813 ± 0.771 |
2.59 ± 0.214 | 7.686 ± 0.494 |
2.421 ± 0.505 | 6.194 ± 0.804 |
6.56 ± 0.847 | 8.418 ± 0.686 |
Met |
Asn |
Gln |
Pro |
Arg |
Ser |
Thr |
Val |
Trp |
Tyr |
|---|---|---|---|---|---|---|---|---|---|
1.802 ± 0.196 | 4.505 ± 0.653 |
5.377 ± 0.519 | 6.025 ± 0.465 |
6.363 ± 0.836 | 5.377 ± 0.592 |
5.743 ± 0.514 | 6.334 ± 0.479 |
2.703 ± 0.214 | 2.618 ± 0.282 |
Most of the basic statistics you can see at this page can be downloaded from this CSV file
See this proteome in:

Proteome-pI is available under Creative Commons Attribution-NoDerivs license, for more details see here
| Reference: Kozlowski LP. Proteome-pI 2.0: Proteome Isoelectric Point Database Update. Nucleic Acids Res. 2021, doi: 10.1093/nar/gkab944 | Contact: Lukasz P. Kozlowski |