Nitrospirillum amazonense CBAmc
Taxonomy: cellular organisms; Bacteria; Proteobacteria; Alphaproteobacteria; Rhodospirillales; Azospirillaceae; Nitrospirillum; Nitrospirillum amazonense
Average proteome isoelectric point is 6.53
Get precalculated fractions of proteins
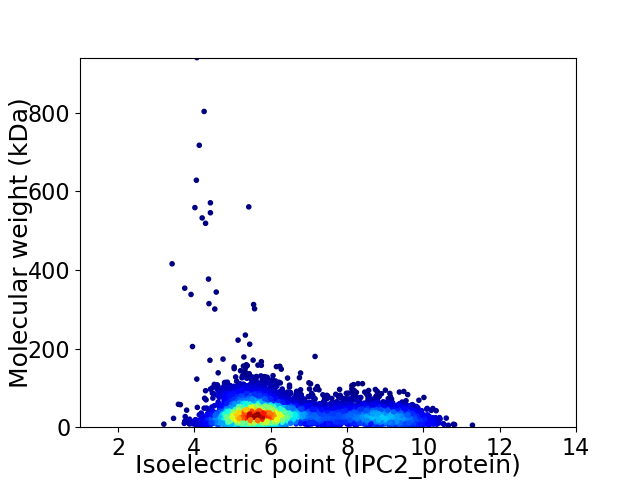
Virtual 2D-PAGE plot for 6034 proteins (isoelectric point calculated using IPC2_protein)
Get csv file with sequences according to given criteria:
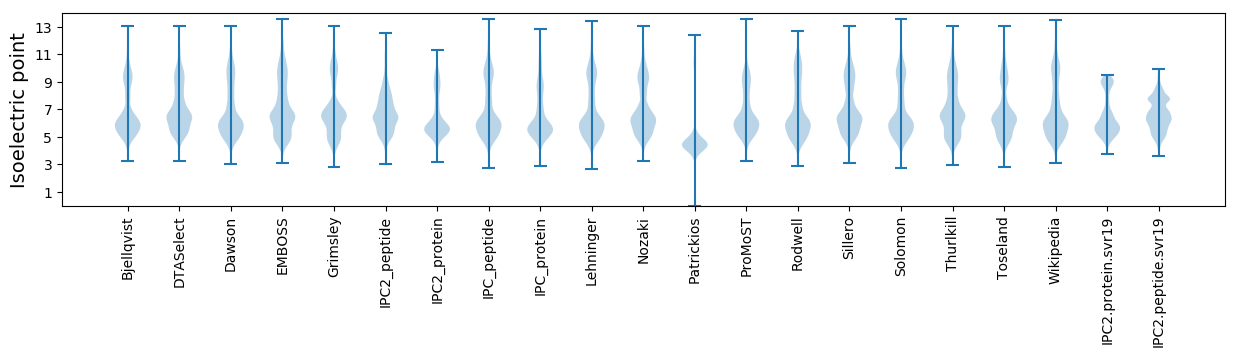
* You can choose from 21 different methods for calculating isoelectric point
Summary statistics related to proteome-wise predictions
Protein with the lowest isoelectric point:
>tr|A0A248K1B3|A0A248K1B3_9PROT Chemotaxis protein OS=Nitrospirillum amazonense CBAmc OX=1441467 GN=Y958_22900 PE=4 SV=1
MM1 pKa = 7.56SSASDD6 pKa = 3.57SPTDD10 pKa = 3.64DD11 pKa = 4.05GEE13 pKa = 4.39IVSVDD18 pKa = 3.25TSDD21 pKa = 3.41PTVACLSIVSWSMAIAALGAIVLLALVLMLLNVSQYY57 pKa = 9.98VFLMVWIIGAPFAAAVAALGVLFIQLNQRR86 pKa = 11.84SQHH89 pKa = 4.62GG90 pKa = 3.46
MM1 pKa = 7.56SSASDD6 pKa = 3.57SPTDD10 pKa = 3.64DD11 pKa = 4.05GEE13 pKa = 4.39IVSVDD18 pKa = 3.25TSDD21 pKa = 3.41PTVACLSIVSWSMAIAALGAIVLLALVLMLLNVSQYY57 pKa = 9.98VFLMVWIIGAPFAAAVAALGVLFIQLNQRR86 pKa = 11.84SQHH89 pKa = 4.62GG90 pKa = 3.46
Molecular weight: 9.36 kDa
Isoelectric point according different methods:
Protein with the highest isoelectric point:
>tr|A0A248JM57|A0A248JM57_9PROT Vitamin B12-dependent ribonucleotide reductase OS=Nitrospirillum amazonense CBAmc OX=1441467 GN=Y958_02350 PE=3 SV=1
MM1 pKa = 7.45KK2 pKa = 9.59RR3 pKa = 11.84TFQPSKK9 pKa = 9.58LVRR12 pKa = 11.84ARR14 pKa = 11.84RR15 pKa = 11.84HH16 pKa = 4.38GFRR19 pKa = 11.84ARR21 pKa = 11.84MATPGGRR28 pKa = 11.84KK29 pKa = 8.81VLARR33 pKa = 11.84RR34 pKa = 11.84RR35 pKa = 11.84AQGRR39 pKa = 11.84KK40 pKa = 9.16RR41 pKa = 11.84LSAA44 pKa = 3.93
MM1 pKa = 7.45KK2 pKa = 9.59RR3 pKa = 11.84TFQPSKK9 pKa = 9.58LVRR12 pKa = 11.84ARR14 pKa = 11.84RR15 pKa = 11.84HH16 pKa = 4.38GFRR19 pKa = 11.84ARR21 pKa = 11.84MATPGGRR28 pKa = 11.84KK29 pKa = 8.81VLARR33 pKa = 11.84RR34 pKa = 11.84RR35 pKa = 11.84AQGRR39 pKa = 11.84KK40 pKa = 9.16RR41 pKa = 11.84LSAA44 pKa = 3.93
Molecular weight: 5.12 kDa
Isoelectric point according different methods:
Peptides (in silico digests for buttom-up proteomics)
Below you can find in silico digests of the whole proteome with Trypsin, Chymotrypsin, Trypsin+LysC, LysN, ArgC proteases suitable for different mass spec machines.| Try ESI |
 |
|---|
| ChTry ESI |
|
|---|
| ArgC ESI |
|
|---|
| LysN ESI |
|
|---|
| TryLysC ESI |
|
|---|
| Try MALDI |
|
|---|
| ChTry MALDI |
|
|---|
| ArgC MALDI |
|
|---|
| LysN MALDI |
|
|---|
| TryLysC MALDI |
|
|---|
| Try LTQ |
|
|---|
| ChTry LTQ |
|
|---|
| ArgC LTQ |
|
|---|
| LysN LTQ |
|
|---|
| TryLysC LTQ |
|
|---|
| Try MSlow |
|
|---|
| ChTry MSlow |
|
|---|
| ArgC MSlow |
|
|---|
| LysN MSlow |
|
|---|
| TryLysC MSlow |
|
|---|
| Try MShigh |
|
|---|
| ChTry MShigh |
|
|---|
| ArgC MShigh |
|
|---|
| LysN MShigh |
|
|---|
| TryLysC MShigh |
|
|---|
General Statistics
Number of major isoforms |
Number of additional isoforms |
Number of all proteins |
Number of amino acids |
Min. Seq. Length |
Max. Seq. Length |
Avg. Seq. Length |
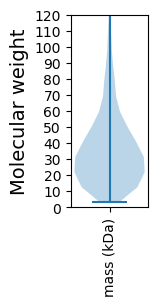
Avg. Mol. Weight |
|---|---|---|---|---|---|---|---|
0 |
2143625 |
26 |
9845 |
355.3 |
38.07 |
Amino acid frequency
Ala |
Cys |
Asp |
Glu |
Phe |
Gly |
His |
Ile |
Lys |
Leu |
|---|---|---|---|---|---|---|---|---|---|
13.472 ± 0.05 | 0.742 ± 0.011 |
5.845 ± 0.035 | 4.636 ± 0.047 |
3.194 ± 0.025 | 9.303 ± 0.083 |
2.092 ± 0.021 | 4.198 ± 0.026 |
2.617 ± 0.03 | 10.625 ± 0.04 |
Met |
Asn |
Gln |
Pro |
Arg |
Ser |
Thr |
Val |
Trp |
Tyr |
|---|---|---|---|---|---|---|---|---|---|
2.209 ± 0.021 | 2.571 ± 0.047 |
5.566 ± 0.052 | 3.386 ± 0.027 |
6.992 ± 0.064 | 5.014 ± 0.065 |
6.085 ± 0.09 | 7.752 ± 0.026 |
1.377 ± 0.016 | 2.325 ± 0.019 |
Most of the basic statistics you can see at this page can be downloaded from this CSV file
See this proteome in:

Proteome-pI is available under Creative Commons Attribution-NoDerivs license, for more details see here
| Reference: Kozlowski LP. Proteome-pI 2.0: Proteome Isoelectric Point Database Update. Nucleic Acids Res. 2021, doi: 10.1093/nar/gkab944 | Contact: Lukasz P. Kozlowski |