Alistipes finegoldii CAG:68
Taxonomy: cellular organisms; Bacteria; FCB group; Bacteroidetes/Chlorobi group; Bacteroidetes; Bacteroidia; Bacteroidales; Rikenellaceae; Alistipes; environmental samples
Average proteome isoelectric point is 6.46
Get precalculated fractions of proteins
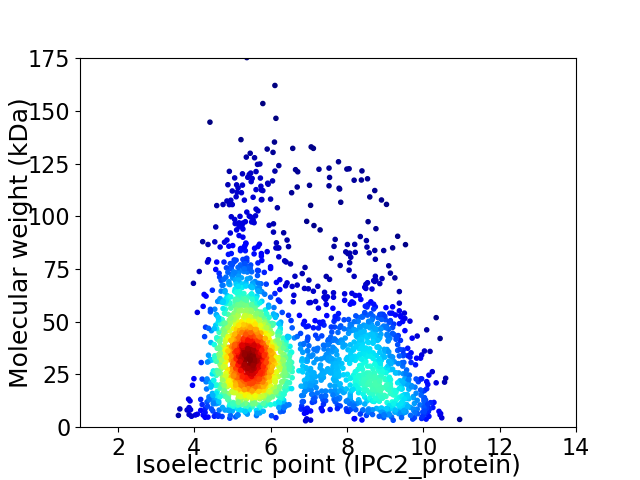
Virtual 2D-PAGE plot for 2386 proteins (isoelectric point calculated using IPC2_protein)
Get csv file with sequences according to given criteria:
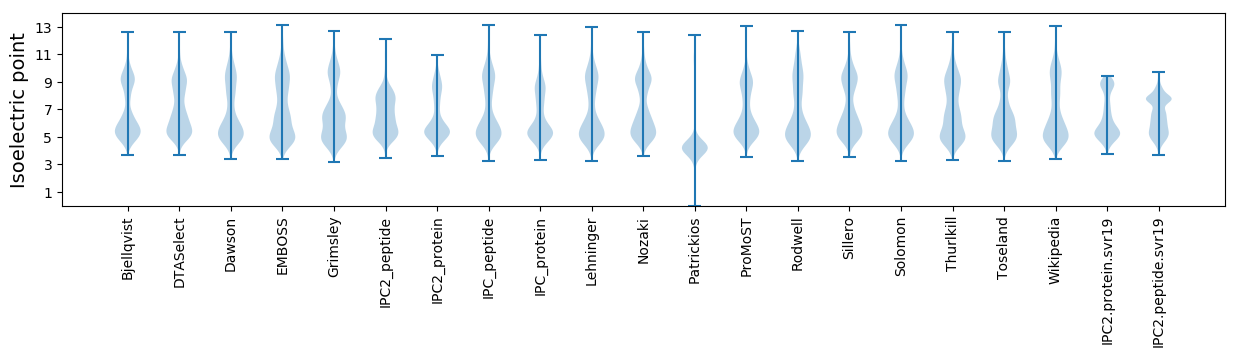
* You can choose from 21 different methods for calculating isoelectric point
Summary statistics related to proteome-wise predictions
Protein with the lowest isoelectric point:
>tr|R5V5X0|R5V5X0_9BACT Putative lipoprotein OS=Alistipes finegoldii CAG:68 OX=1263035 GN=BN754_01677 PE=4 SV=1
MM1 pKa = 7.48KK2 pKa = 10.09KK3 pKa = 10.02YY4 pKa = 10.58RR5 pKa = 11.84CIVCEE10 pKa = 4.64WIYY13 pKa = 11.39DD14 pKa = 3.98PAVGDD19 pKa = 4.02PDD21 pKa = 4.71GGIAPGTSFEE31 pKa = 5.8DD32 pKa = 4.31IPDD35 pKa = 3.57DD36 pKa = 3.86WVCPVCGVGKK46 pKa = 9.92DD47 pKa = 3.28QFEE50 pKa = 4.43EE51 pKa = 4.35VEE53 pKa = 4.24EE54 pKa = 4.22
MM1 pKa = 7.48KK2 pKa = 10.09KK3 pKa = 10.02YY4 pKa = 10.58RR5 pKa = 11.84CIVCEE10 pKa = 4.64WIYY13 pKa = 11.39DD14 pKa = 3.98PAVGDD19 pKa = 4.02PDD21 pKa = 4.71GGIAPGTSFEE31 pKa = 5.8DD32 pKa = 4.31IPDD35 pKa = 3.57DD36 pKa = 3.86WVCPVCGVGKK46 pKa = 9.92DD47 pKa = 3.28QFEE50 pKa = 4.43EE51 pKa = 4.35VEE53 pKa = 4.24EE54 pKa = 4.22
Molecular weight: 6.01 kDa
Isoelectric point according different methods:
Protein with the highest isoelectric point:
>tr|R5UF25|R5UF25_9BACT Inositol-1-monophosphatase OS=Alistipes finegoldii CAG:68 OX=1263035 GN=BN754_02141 PE=3 SV=1
MM1 pKa = 7.84PNGKK5 pKa = 8.55KK6 pKa = 9.72HH7 pKa = 6.1KK8 pKa = 7.52RR9 pKa = 11.84HH10 pKa = 5.93KK11 pKa = 9.95MATHH15 pKa = 6.02KK16 pKa = 10.34RR17 pKa = 11.84KK18 pKa = 9.84KK19 pKa = 9.28RR20 pKa = 11.84LRR22 pKa = 11.84KK23 pKa = 9.26NRR25 pKa = 11.84HH26 pKa = 4.71KK27 pKa = 10.87KK28 pKa = 9.36KK29 pKa = 10.77
MM1 pKa = 7.84PNGKK5 pKa = 8.55KK6 pKa = 9.72HH7 pKa = 6.1KK8 pKa = 7.52RR9 pKa = 11.84HH10 pKa = 5.93KK11 pKa = 9.95MATHH15 pKa = 6.02KK16 pKa = 10.34RR17 pKa = 11.84KK18 pKa = 9.84KK19 pKa = 9.28RR20 pKa = 11.84LRR22 pKa = 11.84KK23 pKa = 9.26NRR25 pKa = 11.84HH26 pKa = 4.71KK27 pKa = 10.87KK28 pKa = 9.36KK29 pKa = 10.77
Molecular weight: 3.69 kDa
Isoelectric point according different methods:
Peptides (in silico digests for buttom-up proteomics)
Below you can find in silico digests of the whole proteome with Trypsin, Chymotrypsin, Trypsin+LysC, LysN, ArgC proteases suitable for different mass spec machines.| Try ESI |
 |
|---|
| ChTry ESI |
|
|---|
| ArgC ESI |
|
|---|
| LysN ESI |
|
|---|
| TryLysC ESI |
|
|---|
| Try MALDI |
|
|---|
| ChTry MALDI |
|
|---|
| ArgC MALDI |
|
|---|
| LysN MALDI |
|
|---|
| TryLysC MALDI |
|
|---|
| Try LTQ |
|
|---|
| ChTry LTQ |
|
|---|
| ArgC LTQ |
|
|---|
| LysN LTQ |
|
|---|
| TryLysC LTQ |
|
|---|
| Try MSlow |
|
|---|
| ChTry MSlow |
|
|---|
| ArgC MSlow |
|
|---|
| LysN MSlow |
|
|---|
| TryLysC MSlow |
|
|---|
| Try MShigh |
|
|---|
| ChTry MShigh |
|
|---|
| ArgC MShigh |
|
|---|
| LysN MShigh |
|
|---|
| TryLysC MShigh |
|
|---|
General Statistics
Number of major isoforms |
Number of additional isoforms |
Number of all proteins |
Number of amino acids |
Min. Seq. Length |
Max. Seq. Length |
Avg. Seq. Length |
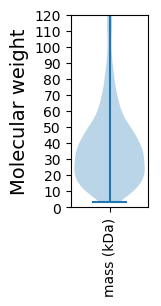
Avg. Mol. Weight |
|---|---|---|---|---|---|---|---|
0 |
820531 |
29 |
1632 |
343.9 |
38.27 |
Amino acid frequency
Ala |
Cys |
Asp |
Glu |
Phe |
Gly |
His |
Ile |
Lys |
Leu |
|---|---|---|---|---|---|---|---|---|---|
9.463 ± 0.062 | 1.273 ± 0.019 |
5.673 ± 0.034 | 6.304 ± 0.052 |
4.299 ± 0.029 | 7.774 ± 0.045 |
1.819 ± 0.023 | 5.716 ± 0.041 |
4.702 ± 0.048 | 8.938 ± 0.059 |
Met |
Asn |
Gln |
Pro |
Arg |
Ser |
Thr |
Val |
Trp |
Tyr |
|---|---|---|---|---|---|---|---|---|---|
2.607 ± 0.024 | 3.909 ± 0.05 |
4.201 ± 0.029 | 3.017 ± 0.026 |
6.462 ± 0.058 | 5.703 ± 0.043 |
5.697 ± 0.045 | 7.148 ± 0.046 |
1.278 ± 0.02 | 4.012 ± 0.034 |
Most of the basic statistics you can see at this page can be downloaded from this CSV file
See this proteome in:

Proteome-pI is available under Creative Commons Attribution-NoDerivs license, for more details see here
| Reference: Kozlowski LP. Proteome-pI 2.0: Proteome Isoelectric Point Database Update. Nucleic Acids Res. 2021, doi: 10.1093/nar/gkab944 | Contact: Lukasz P. Kozlowski |