Microbacterium phage Zepp
Taxonomy: Viruses; Duplodnaviria; Heunggongvirae; Uroviricota; Caudoviricetes; Caudovirales; Siphoviridae; Neferthenavirus; unclassified Neferthenavirus
Average proteome isoelectric point is 6.47
Get precalculated fractions of proteins
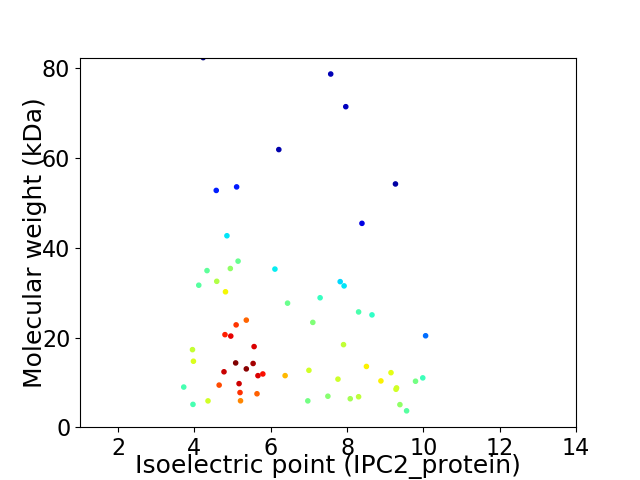
Virtual 2D-PAGE plot for 62 proteins (isoelectric point calculated using IPC2_protein)
Get csv file with sequences according to given criteria:
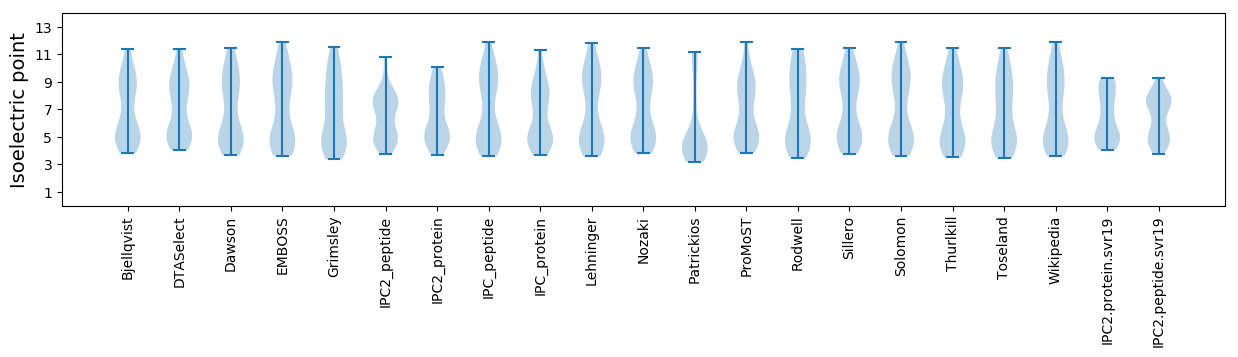
* You can choose from 21 different methods for calculating isoelectric point
Summary statistics related to proteome-wise predictions
Protein with the lowest isoelectric point:
>tr|A0A6G6XJZ8|A0A6G6XJZ8_9CAUD Uncharacterized protein OS=Microbacterium phage Zepp OX=2704041 GN=14 PE=4 SV=1
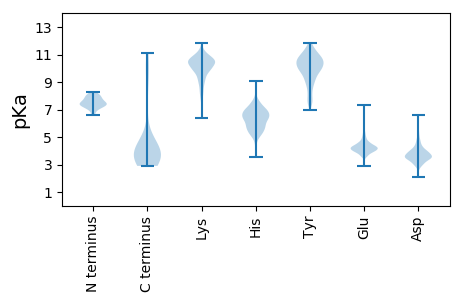
MM1 pKa = 7.37TVTLYY6 pKa = 10.55DD7 pKa = 3.56AQGTPIAGDD16 pKa = 3.43ATAGQHH22 pKa = 4.9MRR24 pKa = 11.84DD25 pKa = 3.57RR26 pKa = 11.84ADD28 pKa = 3.37EE29 pKa = 4.3LGGYY33 pKa = 9.46IKK35 pKa = 10.74DD36 pKa = 4.12DD37 pKa = 3.54ATGDD41 pKa = 3.6TIYY44 pKa = 10.65PEE46 pKa = 4.27EE47 pKa = 4.33GG48 pKa = 3.06
MM1 pKa = 7.37TVTLYY6 pKa = 10.55DD7 pKa = 3.56AQGTPIAGDD16 pKa = 3.43ATAGQHH22 pKa = 4.9MRR24 pKa = 11.84DD25 pKa = 3.57RR26 pKa = 11.84ADD28 pKa = 3.37EE29 pKa = 4.3LGGYY33 pKa = 9.46IKK35 pKa = 10.74DD36 pKa = 4.12DD37 pKa = 3.54ATGDD41 pKa = 3.6TIYY44 pKa = 10.65PEE46 pKa = 4.27EE47 pKa = 4.33GG48 pKa = 3.06
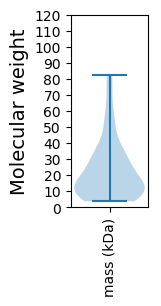
Molecular weight: 5.09 kDa
Isoelectric point according different methods:
Protein with the highest isoelectric point:
>tr|A0A6G6XJ77|A0A6G6XJ77_9CAUD Uncharacterized protein OS=Microbacterium phage Zepp OX=2704041 GN=60 PE=4 SV=1
MM1 pKa = 7.61KK2 pKa = 10.45LPRR5 pKa = 11.84RR6 pKa = 11.84KK7 pKa = 10.0AQVVSNTRR15 pKa = 11.84SHH17 pKa = 7.16LGICSNPCTPTRR29 pKa = 11.84DD30 pKa = 3.51ALVV33 pKa = 3.26
MM1 pKa = 7.61KK2 pKa = 10.45LPRR5 pKa = 11.84RR6 pKa = 11.84KK7 pKa = 10.0AQVVSNTRR15 pKa = 11.84SHH17 pKa = 7.16LGICSNPCTPTRR29 pKa = 11.84DD30 pKa = 3.51ALVV33 pKa = 3.26
Molecular weight: 3.65 kDa
Isoelectric point according different methods:
Peptides (in silico digests for buttom-up proteomics)
Below you can find in silico digests of the whole proteome with Trypsin, Chymotrypsin, Trypsin+LysC, LysN, ArgC proteases suitable for different mass spec machines.| Try ESI |
 |
|---|
| ChTry ESI |
|
|---|
| ArgC ESI |
|
|---|
| LysN ESI |
|
|---|
| TryLysC ESI |
|
|---|
| Try MALDI |
|
|---|
| ChTry MALDI |
|
|---|
| ArgC MALDI |
|
|---|
| LysN MALDI |
|
|---|
| TryLysC MALDI |
|
|---|
| Try LTQ |
|
|---|
| ChTry LTQ |
|
|---|
| ArgC LTQ |
|
|---|
| LysN LTQ |
|
|---|
| TryLysC LTQ |
|
|---|
| Try MSlow |
|
|---|
| ChTry MSlow |
|
|---|
| ArgC MSlow |
|
|---|
| LysN MSlow |
|
|---|
| TryLysC MSlow |
|
|---|
| Try MShigh |
|
|---|
| ChTry MShigh |
|
|---|
| ArgC MShigh |
|
|---|
| LysN MShigh |
|
|---|
| TryLysC MShigh |
|
|---|
General Statistics
Number of major isoforms |
Number of additional isoforms |
Number of all proteins |
Number of amino acids |
Min. Seq. Length |
Max. Seq. Length |
Avg. Seq. Length |
Avg. Mol. Weight |
|---|---|---|---|---|---|---|---|
0 |
13031 |
33 |
813 |
210.2 |
23.11 |
Amino acid frequency
Ala |
Cys |
Asp |
Glu |
Phe |
Gly |
His |
Ile |
Lys |
Leu |
|---|---|---|---|---|---|---|---|---|---|
10.636 ± 0.464 | 0.729 ± 0.09 |
6.308 ± 0.374 | 6.139 ± 0.428 |
3.154 ± 0.224 | 7.812 ± 0.299 |
1.895 ± 0.183 | 5.142 ± 0.38 |
4.942 ± 0.333 | 8.273 ± 0.321 |
Met |
Asn |
Gln |
Pro |
Arg |
Ser |
Thr |
Val |
Trp |
Tyr |
|---|---|---|---|---|---|---|---|---|---|
2.318 ± 0.153 | 3.407 ± 0.203 |
4.919 ± 0.23 | 4.274 ± 0.216 |
5.955 ± 0.372 | 5.495 ± 0.29 |
6.508 ± 0.322 | 7.574 ± 0.315 |
1.865 ± 0.172 | 2.655 ± 0.187 |
Most of the basic statistics you can see at this page can be downloaded from this CSV file
See this proteome in:

Proteome-pI is available under Creative Commons Attribution-NoDerivs license, for more details see here
| Reference: Kozlowski LP. Proteome-pI 2.0: Proteome Isoelectric Point Database Update. Nucleic Acids Res. 2021, doi: 10.1093/nar/gkab944 | Contact: Lukasz P. Kozlowski |