Vibrio phage VHML
Taxonomy: Viruses; Duplodnaviria; Heunggongvirae; Uroviricota; Caudoviricetes; Caudovirales; Myoviridae; Vhmlvirus; Vibrio virus VHML
Average proteome isoelectric point is 6.34
Get precalculated fractions of proteins
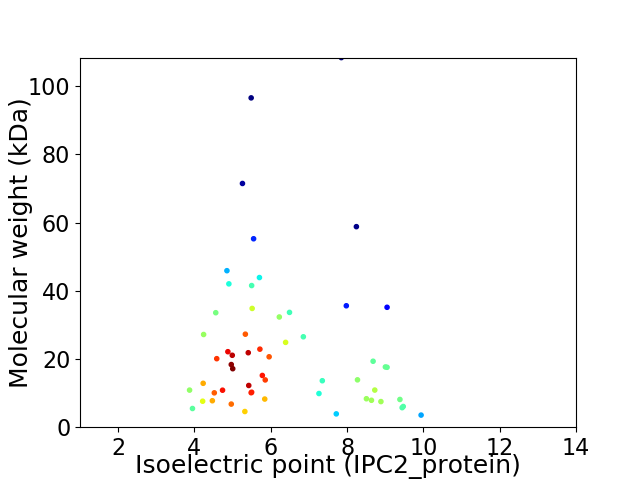
Virtual 2D-PAGE plot for 57 proteins (isoelectric point calculated using IPC2_protein)
Get csv file with sequences according to given criteria:
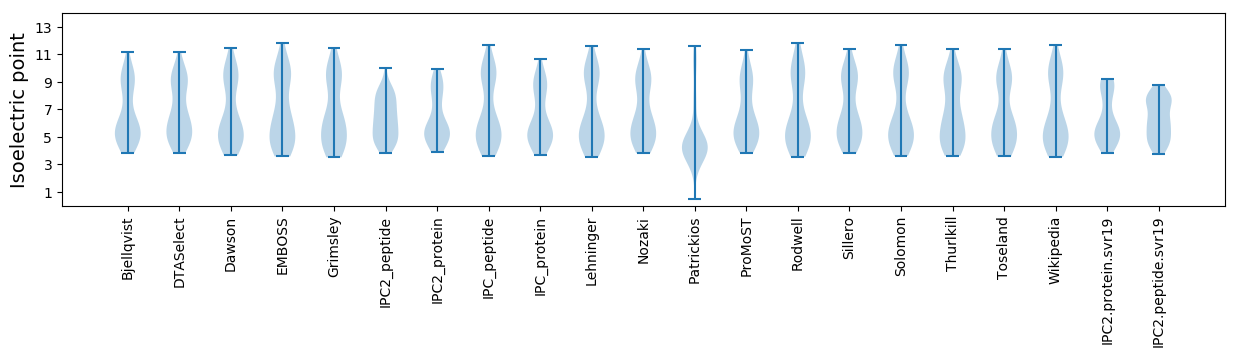
* You can choose from 21 different methods for calculating isoelectric point
Summary statistics related to proteome-wise predictions
Protein with the lowest isoelectric point:
>tr|Q8H9K9|Q8H9K9_9CAUD ORF58 OS=Vibrio phage VHML OX=207597 GN=orf58 PE=4 SV=1
MM1 pKa = 7.68SDD3 pKa = 2.65WDD5 pKa = 3.67FTVAGFLIGEE15 pKa = 4.41YY16 pKa = 10.02GPVMSGEE23 pKa = 4.15LPYY26 pKa = 10.6HH27 pKa = 6.57EE28 pKa = 5.91LMQQEE33 pKa = 4.24AEE35 pKa = 4.2EE36 pKa = 4.21EE37 pKa = 4.44KK38 pKa = 10.36EE39 pKa = 4.51TVQLQCGLSGG49 pKa = 3.41
MM1 pKa = 7.68SDD3 pKa = 2.65WDD5 pKa = 3.67FTVAGFLIGEE15 pKa = 4.41YY16 pKa = 10.02GPVMSGEE23 pKa = 4.15LPYY26 pKa = 10.6HH27 pKa = 6.57EE28 pKa = 5.91LMQQEE33 pKa = 4.24AEE35 pKa = 4.2EE36 pKa = 4.21EE37 pKa = 4.44KK38 pKa = 10.36EE39 pKa = 4.51TVQLQCGLSGG49 pKa = 3.41
Molecular weight: 5.48 kDa
Isoelectric point according different methods:
Protein with the highest isoelectric point:
>tr|Q8H9Q0|Q8H9Q0_9CAUD ORF15 OS=Vibrio phage VHML OX=207597 GN=orf15 PE=4 SV=1
MM1 pKa = 7.86DD2 pKa = 5.89KK3 pKa = 10.37IARR6 pKa = 11.84LPAISASANRR16 pKa = 11.84LKK18 pKa = 10.87AIWSKK23 pKa = 10.55VIKK26 pKa = 10.7VSIAQTAA33 pKa = 2.94
MM1 pKa = 7.86DD2 pKa = 5.89KK3 pKa = 10.37IARR6 pKa = 11.84LPAISASANRR16 pKa = 11.84LKK18 pKa = 10.87AIWSKK23 pKa = 10.55VIKK26 pKa = 10.7VSIAQTAA33 pKa = 2.94
Molecular weight: 3.55 kDa
Isoelectric point according different methods:
Peptides (in silico digests for buttom-up proteomics)
Below you can find in silico digests of the whole proteome with Trypsin, Chymotrypsin, Trypsin+LysC, LysN, ArgC proteases suitable for different mass spec machines.| Try ESI |
 |
|---|
| ChTry ESI |
|
|---|
| ArgC ESI |
|
|---|
| LysN ESI |
|
|---|
| TryLysC ESI |
|
|---|
| Try MALDI |
|
|---|
| ChTry MALDI |
|
|---|
| ArgC MALDI |
|
|---|
| LysN MALDI |
|
|---|
| TryLysC MALDI |
|
|---|
| Try LTQ |
|
|---|
| ChTry LTQ |
|
|---|
| ArgC LTQ |
|
|---|
| LysN LTQ |
|
|---|
| TryLysC LTQ |
|
|---|
| Try MSlow |
|
|---|
| ChTry MSlow |
|
|---|
| ArgC MSlow |
|
|---|
| LysN MSlow |
|
|---|
| TryLysC MSlow |
|
|---|
| Try MShigh |
|
|---|
| ChTry MShigh |
|
|---|
| ArgC MShigh |
|
|---|
| LysN MShigh |
|
|---|
| TryLysC MShigh |
|
|---|
General Statistics
Number of major isoforms |
Number of additional isoforms |
Number of all proteins |
Number of amino acids |
Min. Seq. Length |
Max. Seq. Length |
Avg. Seq. Length |
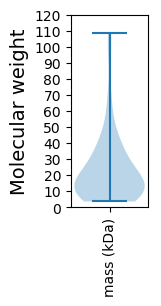
Avg. Mol. Weight |
|---|---|---|---|---|---|---|---|
0 |
12043 |
33 |
1023 |
211.3 |
23.5 |
Amino acid frequency
Ala |
Cys |
Asp |
Glu |
Phe |
Gly |
His |
Ile |
Lys |
Leu |
|---|---|---|---|---|---|---|---|---|---|
9.632 ± 0.674 | 1.187 ± 0.148 |
5.937 ± 0.32 | 7.1 ± 0.289 |
3.346 ± 0.199 | 7.183 ± 0.252 |
2.043 ± 0.209 | 4.874 ± 0.18 |
5.771 ± 0.286 | 9.068 ± 0.287 |
Met |
Asn |
Gln |
Pro |
Arg |
Ser |
Thr |
Val |
Trp |
Tyr |
|---|---|---|---|---|---|---|---|---|---|
2.491 ± 0.173 | 4.011 ± 0.205 |
3.82 ± 0.245 | 4.75 ± 0.305 |
5.671 ± 0.294 | 5.904 ± 0.211 |
5.439 ± 0.168 | 7.058 ± 0.234 |
1.544 ± 0.163 | 3.114 ± 0.218 |
Most of the basic statistics you can see at this page can be downloaded from this CSV file
See this proteome in:

Proteome-pI is available under Creative Commons Attribution-NoDerivs license, for more details see here
| Reference: Kozlowski LP. Proteome-pI 2.0: Proteome Isoelectric Point Database Update. Nucleic Acids Res. 2021, doi: 10.1093/nar/gkab944 | Contact: Lukasz P. Kozlowski |