Sulfolobus spindle-shaped virus 6
Taxonomy: Viruses; Fuselloviridae; Betafusellovirus
Average proteome isoelectric point is 7.68
Get precalculated fractions of proteins
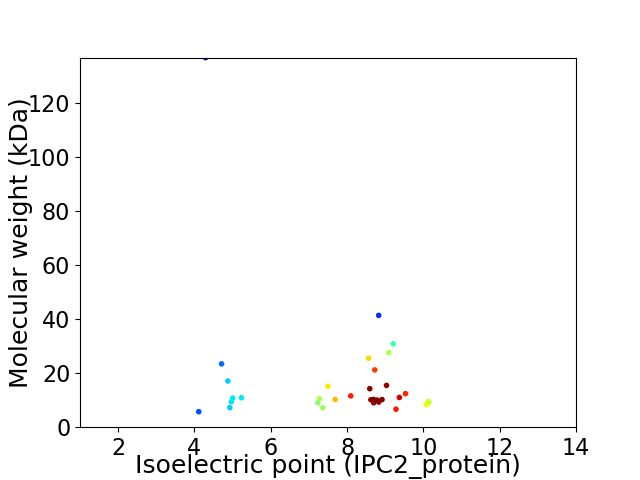
Virtual 2D-PAGE plot for 33 proteins (isoelectric point calculated using IPC2_protein)
Get csv file with sequences according to given criteria:
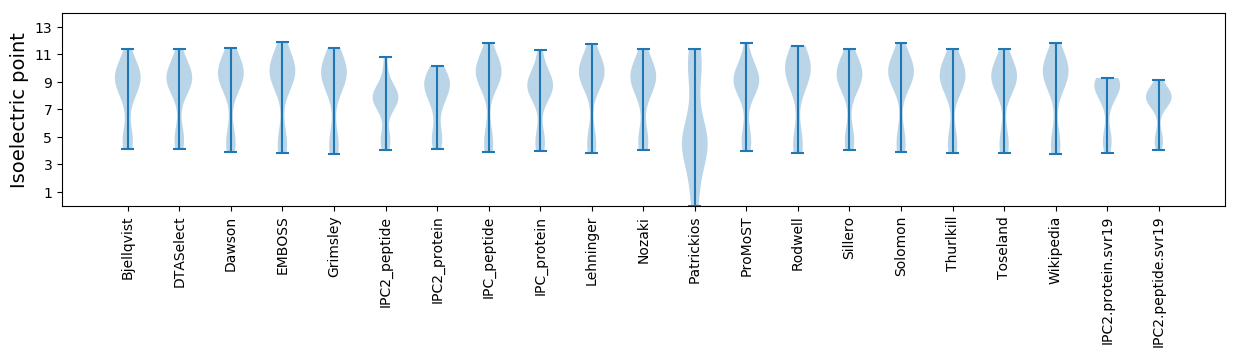
* You can choose from 21 different methods for calculating isoelectric point
Summary statistics related to proteome-wise predictions
Protein with the lowest isoelectric point:
>tr|D1GF38|D1GF38_9VIRU Uncharacterized protein OS=Sulfolobus spindle-shaped virus 6 OX=693627 PE=4 SV=1
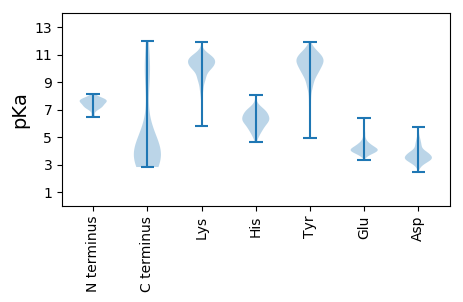
MM1 pKa = 8.17SEE3 pKa = 3.7EE4 pKa = 4.56LEE6 pKa = 4.32YY7 pKa = 10.5IKK9 pKa = 10.85QKK11 pKa = 10.67LDD13 pKa = 4.09EE14 pKa = 5.0ILDD17 pKa = 3.78EE18 pKa = 5.38CICSDD23 pKa = 3.82PEE25 pKa = 3.8EE26 pKa = 4.11LRR28 pKa = 11.84EE29 pKa = 4.77LEE31 pKa = 4.55EE32 pKa = 3.79ILKK35 pKa = 10.46KK36 pKa = 10.08IEE38 pKa = 4.04YY39 pKa = 9.83VLGYY43 pKa = 10.1CQMGDD48 pKa = 2.99
MM1 pKa = 8.17SEE3 pKa = 3.7EE4 pKa = 4.56LEE6 pKa = 4.32YY7 pKa = 10.5IKK9 pKa = 10.85QKK11 pKa = 10.67LDD13 pKa = 4.09EE14 pKa = 5.0ILDD17 pKa = 3.78EE18 pKa = 5.38CICSDD23 pKa = 3.82PEE25 pKa = 3.8EE26 pKa = 4.11LRR28 pKa = 11.84EE29 pKa = 4.77LEE31 pKa = 4.55EE32 pKa = 3.79ILKK35 pKa = 10.46KK36 pKa = 10.08IEE38 pKa = 4.04YY39 pKa = 9.83VLGYY43 pKa = 10.1CQMGDD48 pKa = 2.99
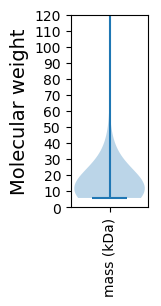
Molecular weight: 5.73 kDa
Isoelectric point according different methods:
Protein with the highest isoelectric point:
>tr|D1GF47|D1GF47_9VIRU Putative end-filament protein OS=Sulfolobus spindle-shaped virus 6 OX=693627 PE=4 SV=1
MM1 pKa = 7.52GVRR4 pKa = 11.84FSYY7 pKa = 10.7RR8 pKa = 11.84LNFHH12 pKa = 6.19GNRR15 pKa = 11.84VEE17 pKa = 4.31IYY19 pKa = 7.14GTCRR23 pKa = 11.84LSSIRR28 pKa = 11.84RR29 pKa = 11.84CFSLLSKK36 pKa = 9.48FLWSYY41 pKa = 9.72TLLHH45 pKa = 6.27HH46 pKa = 6.27LHH48 pKa = 6.52FRR50 pKa = 11.84FHH52 pKa = 7.36SCGNWSKK59 pKa = 11.69SNNKK63 pKa = 9.28AIWWRR68 pKa = 3.6
MM1 pKa = 7.52GVRR4 pKa = 11.84FSYY7 pKa = 10.7RR8 pKa = 11.84LNFHH12 pKa = 6.19GNRR15 pKa = 11.84VEE17 pKa = 4.31IYY19 pKa = 7.14GTCRR23 pKa = 11.84LSSIRR28 pKa = 11.84RR29 pKa = 11.84CFSLLSKK36 pKa = 9.48FLWSYY41 pKa = 9.72TLLHH45 pKa = 6.27HH46 pKa = 6.27LHH48 pKa = 6.52FRR50 pKa = 11.84FHH52 pKa = 7.36SCGNWSKK59 pKa = 11.69SNNKK63 pKa = 9.28AIWWRR68 pKa = 3.6
Molecular weight: 8.32 kDa
Isoelectric point according different methods:
Peptides (in silico digests for buttom-up proteomics)
Below you can find in silico digests of the whole proteome with Trypsin, Chymotrypsin, Trypsin+LysC, LysN, ArgC proteases suitable for different mass spec machines.| Try ESI |
 |
|---|
| ChTry ESI |
|
|---|
| ArgC ESI |
|
|---|
| LysN ESI |
|
|---|
| TryLysC ESI |
|
|---|
| Try MALDI |
|
|---|
| ChTry MALDI |
|
|---|
| ArgC MALDI |
|
|---|
| LysN MALDI |
|
|---|
| TryLysC MALDI |
|
|---|
| Try LTQ |
|
|---|
| ChTry LTQ |
|
|---|
| ArgC LTQ |
|
|---|
| LysN LTQ |
|
|---|
| TryLysC LTQ |
|
|---|
| Try MSlow |
|
|---|
| ChTry MSlow |
|
|---|
| ArgC MSlow |
|
|---|
| LysN MSlow |
|
|---|
| TryLysC MSlow |
|
|---|
| Try MShigh |
|
|---|
| ChTry MShigh |
|
|---|
| ArgC MShigh |
|
|---|
| LysN MShigh |
|
|---|
| TryLysC MShigh |
|
|---|
General Statistics
Number of major isoforms |
Number of additional isoforms |
Number of all proteins |
Number of amino acids |
Min. Seq. Length |
Max. Seq. Length |
Avg. Seq. Length |
Avg. Mol. Weight |
|---|---|---|---|---|---|---|---|
0 |
5033 |
48 |
1232 |
152.5 |
17.51 |
Amino acid frequency
Ala |
Cys |
Asp |
Glu |
Phe |
Gly |
His |
Ile |
Lys |
Leu |
|---|---|---|---|---|---|---|---|---|---|
5.007 ± 0.312 | 0.576 ± 0.249 |
3.477 ± 0.347 | 6.06 ± 0.872 |
5.007 ± 0.385 | 5.762 ± 0.725 |
1.351 ± 0.261 | 7.729 ± 0.452 |
7.789 ± 1.614 | 10.491 ± 0.564 |
Met |
Asn |
Gln |
Pro |
Arg |
Ser |
Thr |
Val |
Trp |
Tyr |
|---|---|---|---|---|---|---|---|---|---|
2.345 ± 0.26 | 6.06 ± 0.876 |
3.636 ± 0.574 | 3.537 ± 0.269 |
3.437 ± 0.688 | 6.338 ± 0.6 |
6.179 ± 0.735 | 7.61 ± 0.48 |
1.848 ± 0.273 | 5.762 ± 0.691 |
Most of the basic statistics you can see at this page can be downloaded from this CSV file
See this proteome in:

Proteome-pI is available under Creative Commons Attribution-NoDerivs license, for more details see here
| Reference: Kozlowski LP. Proteome-pI 2.0: Proteome Isoelectric Point Database Update. Nucleic Acids Res. 2021, doi: 10.1093/nar/gkab944 | Contact: Lukasz P. Kozlowski |