Angustibacter sp. Root456
Taxonomy: cellular organisms; Bacteria; Terrabacteria group; Actinobacteria; Actinomycetia; Kineosporiales; Kineosporiaceae; Angustibacter; unclassified Angustibacter
Average proteome isoelectric point is 6.34
Get precalculated fractions of proteins
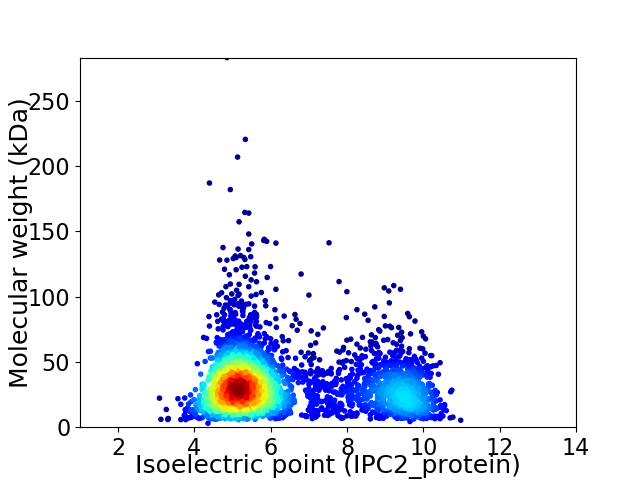
Virtual 2D-PAGE plot for 3495 proteins (isoelectric point calculated using IPC2_protein)
Get csv file with sequences according to given criteria:
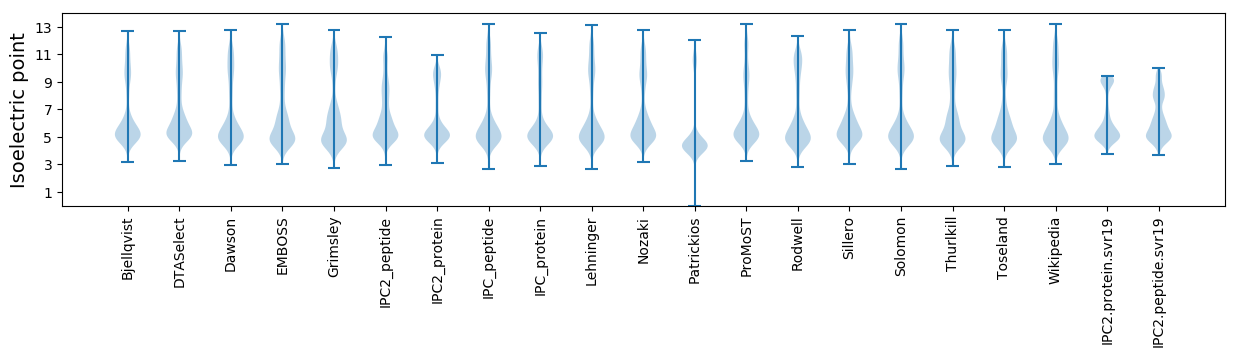
* You can choose from 21 different methods for calculating isoelectric point
Summary statistics related to proteome-wise predictions
Protein with the lowest isoelectric point:
>tr|A0A0Q7JQA4|A0A0Q7JQA4_9ACTN Enoyl-CoA hydratase OS=Angustibacter sp. Root456 OX=1736539 GN=ASD06_12390 PE=3 SV=1
MM1 pKa = 6.47TTATYY6 pKa = 10.65SVTGMTCGHH15 pKa = 6.61CVSAVTSEE23 pKa = 3.87LRR25 pKa = 11.84ALPGVDD31 pKa = 3.83QVDD34 pKa = 3.11VDD36 pKa = 4.42LAAGGVSSVTVTSADD51 pKa = 3.51PLSRR55 pKa = 11.84EE56 pKa = 4.09QVEE59 pKa = 4.53GALDD63 pKa = 3.62EE64 pKa = 5.12AGDD67 pKa = 3.78YY68 pKa = 10.93HH69 pKa = 7.65LAADD73 pKa = 4.15PAA75 pKa = 4.59
MM1 pKa = 6.47TTATYY6 pKa = 10.65SVTGMTCGHH15 pKa = 6.61CVSAVTSEE23 pKa = 3.87LRR25 pKa = 11.84ALPGVDD31 pKa = 3.83QVDD34 pKa = 3.11VDD36 pKa = 4.42LAAGGVSSVTVTSADD51 pKa = 3.51PLSRR55 pKa = 11.84EE56 pKa = 4.09QVEE59 pKa = 4.53GALDD63 pKa = 3.62EE64 pKa = 5.12AGDD67 pKa = 3.78YY68 pKa = 10.93HH69 pKa = 7.65LAADD73 pKa = 4.15PAA75 pKa = 4.59
Molecular weight: 7.54 kDa
Isoelectric point according different methods:
Protein with the highest isoelectric point:
>tr|A0A0Q7JYT8|A0A0Q7JYT8_9ACTN Uncharacterized protein OS=Angustibacter sp. Root456 OX=1736539 GN=ASD06_15375 PE=4 SV=1
MM1 pKa = 7.69SKK3 pKa = 9.0RR4 pKa = 11.84TFQPNNRR11 pKa = 11.84RR12 pKa = 11.84RR13 pKa = 11.84AKK15 pKa = 8.7THH17 pKa = 5.15GFRR20 pKa = 11.84LRR22 pKa = 11.84MRR24 pKa = 11.84TRR26 pKa = 11.84AGRR29 pKa = 11.84AILAARR35 pKa = 11.84RR36 pKa = 11.84RR37 pKa = 11.84KK38 pKa = 9.96GRR40 pKa = 11.84EE41 pKa = 3.72SLSAA45 pKa = 3.72
MM1 pKa = 7.69SKK3 pKa = 9.0RR4 pKa = 11.84TFQPNNRR11 pKa = 11.84RR12 pKa = 11.84RR13 pKa = 11.84AKK15 pKa = 8.7THH17 pKa = 5.15GFRR20 pKa = 11.84LRR22 pKa = 11.84MRR24 pKa = 11.84TRR26 pKa = 11.84AGRR29 pKa = 11.84AILAARR35 pKa = 11.84RR36 pKa = 11.84RR37 pKa = 11.84KK38 pKa = 9.96GRR40 pKa = 11.84EE41 pKa = 3.72SLSAA45 pKa = 3.72
Molecular weight: 5.32 kDa
Isoelectric point according different methods:
Peptides (in silico digests for buttom-up proteomics)
Below you can find in silico digests of the whole proteome with Trypsin, Chymotrypsin, Trypsin+LysC, LysN, ArgC proteases suitable for different mass spec machines.| Try ESI |
 |
|---|
| ChTry ESI |
|
|---|
| ArgC ESI |
|
|---|
| LysN ESI |
|
|---|
| TryLysC ESI |
|
|---|
| Try MALDI |
|
|---|
| ChTry MALDI |
|
|---|
| ArgC MALDI |
|
|---|
| LysN MALDI |
|
|---|
| TryLysC MALDI |
|
|---|
| Try LTQ |
|
|---|
| ChTry LTQ |
|
|---|
| ArgC LTQ |
|
|---|
| LysN LTQ |
|
|---|
| TryLysC LTQ |
|
|---|
| Try MSlow |
|
|---|
| ChTry MSlow |
|
|---|
| ArgC MSlow |
|
|---|
| LysN MSlow |
|
|---|
| TryLysC MSlow |
|
|---|
| Try MShigh |
|
|---|
| ChTry MShigh |
|
|---|
| ArgC MShigh |
|
|---|
| LysN MShigh |
|
|---|
| TryLysC MShigh |
|
|---|
General Statistics
Number of major isoforms |
Number of additional isoforms |
Number of all proteins |
Number of amino acids |
Min. Seq. Length |
Max. Seq. Length |
Avg. Seq. Length |
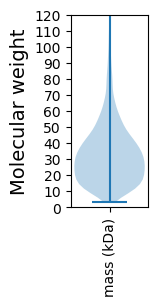
Avg. Mol. Weight |
|---|---|---|---|---|---|---|---|
0 |
1130590 |
26 |
2774 |
323.5 |
34.5 |
Amino acid frequency
Ala |
Cys |
Asp |
Glu |
Phe |
Gly |
His |
Ile |
Lys |
Leu |
|---|---|---|---|---|---|---|---|---|---|
13.96 ± 0.065 | 0.721 ± 0.012 |
6.364 ± 0.035 | 5.171 ± 0.04 |
2.548 ± 0.018 | 9.11 ± 0.033 |
2.28 ± 0.018 | 2.814 ± 0.032 |
1.641 ± 0.029 | 10.646 ± 0.046 |
Met |
Asn |
Gln |
Pro |
Arg |
Ser |
Thr |
Val |
Trp |
Tyr |
|---|---|---|---|---|---|---|---|---|---|
1.653 ± 0.015 | 1.481 ± 0.021 |
5.614 ± 0.035 | 3.085 ± 0.022 |
8.179 ± 0.043 | 5.329 ± 0.029 |
5.861 ± 0.034 | 10.181 ± 0.039 |
1.512 ± 0.015 | 1.845 ± 0.02 |
Most of the basic statistics you can see at this page can be downloaded from this CSV file
See this proteome in:

Proteome-pI is available under Creative Commons Attribution-NoDerivs license, for more details see here
| Reference: Kozlowski LP. Proteome-pI 2.0: Proteome Isoelectric Point Database Update. Nucleic Acids Res. 2021, doi: 10.1093/nar/gkab944 | Contact: Lukasz P. Kozlowski |