Gordonia phage Bantam
Taxonomy: Viruses; Duplodnaviria; Heunggongvirae; Uroviricota; Caudoviricetes; Caudovirales; Siphoviridae; Bantamvirus; Gordonia virus Bantam
Average proteome isoelectric point is 5.87
Get precalculated fractions of proteins
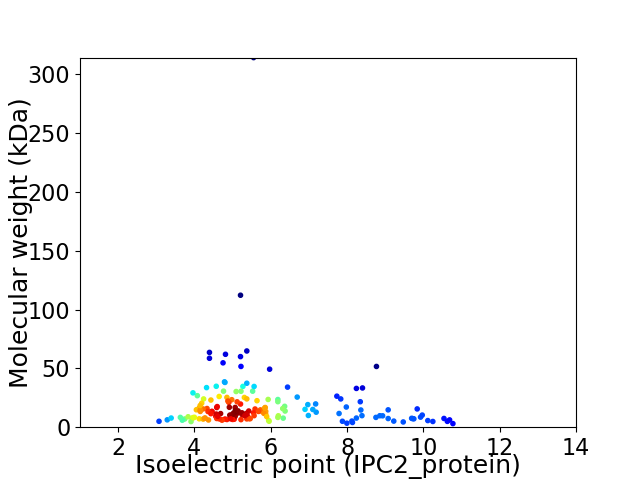
Virtual 2D-PAGE plot for 168 proteins (isoelectric point calculated using IPC2_protein)
Get csv file with sequences according to given criteria:
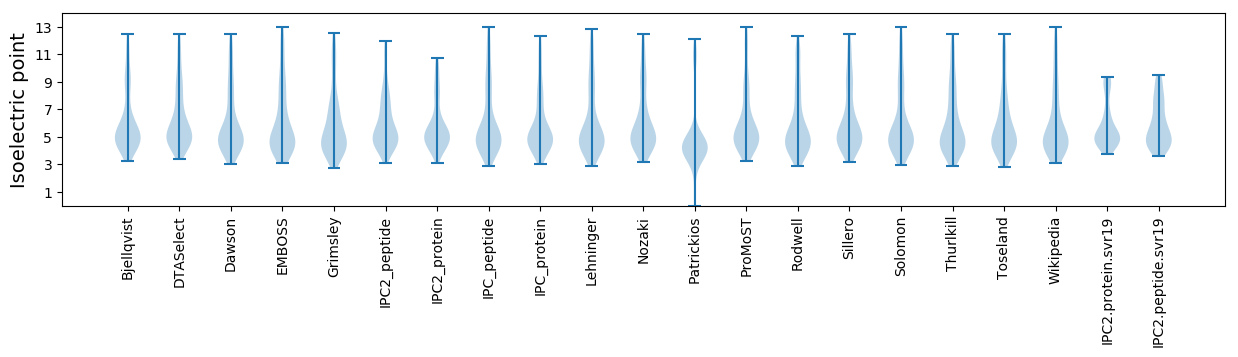
* You can choose from 21 different methods for calculating isoelectric point
Summary statistics related to proteome-wise predictions
Protein with the lowest isoelectric point:
>tr|A0A1B3AYN6|A0A1B3AYN6_9CAUD Uncharacterized protein OS=Gordonia phage Bantam OX=1887641 GN=168 PE=4 SV=1
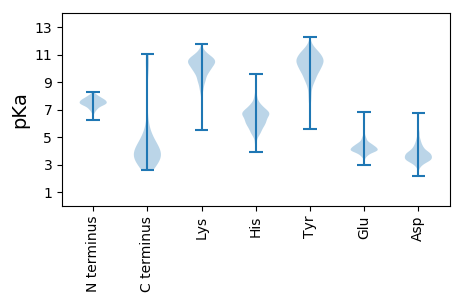
MM1 pKa = 7.91HH2 pKa = 7.86DD3 pKa = 4.18NDD5 pKa = 4.55IDD7 pKa = 4.38DD8 pKa = 3.99EE9 pKa = 4.53TTEE12 pKa = 3.83VEE14 pKa = 4.18LRR16 pKa = 11.84HH17 pKa = 5.42TVTLQVEE24 pKa = 4.52LTVEE28 pKa = 4.88GYY30 pKa = 10.8YY31 pKa = 10.1PDD33 pKa = 5.4DD34 pKa = 5.12DD35 pKa = 4.87YY36 pKa = 12.19EE37 pKa = 4.83GACSMAAQRR46 pKa = 11.84AQEE49 pKa = 3.98ALCLRR54 pKa = 11.84FAPGTHH60 pKa = 6.68IDD62 pKa = 4.97DD63 pKa = 3.52ITTIDD68 pKa = 3.27SRR70 pKa = 11.84EE71 pKa = 3.79II72 pKa = 3.47
MM1 pKa = 7.91HH2 pKa = 7.86DD3 pKa = 4.18NDD5 pKa = 4.55IDD7 pKa = 4.38DD8 pKa = 3.99EE9 pKa = 4.53TTEE12 pKa = 3.83VEE14 pKa = 4.18LRR16 pKa = 11.84HH17 pKa = 5.42TVTLQVEE24 pKa = 4.52LTVEE28 pKa = 4.88GYY30 pKa = 10.8YY31 pKa = 10.1PDD33 pKa = 5.4DD34 pKa = 5.12DD35 pKa = 4.87YY36 pKa = 12.19EE37 pKa = 4.83GACSMAAQRR46 pKa = 11.84AQEE49 pKa = 3.98ALCLRR54 pKa = 11.84FAPGTHH60 pKa = 6.68IDD62 pKa = 4.97DD63 pKa = 3.52ITTIDD68 pKa = 3.27SRR70 pKa = 11.84EE71 pKa = 3.79II72 pKa = 3.47
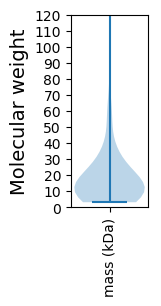
Molecular weight: 8.14 kDa
Isoelectric point according different methods:
Protein with the highest isoelectric point:
>tr|A0A1B3AY69|A0A1B3AY69_9CAUD Uncharacterized protein OS=Gordonia phage Bantam OX=1887641 GN=5 PE=4 SV=1
MM1 pKa = 7.39AVSLIKK7 pKa = 10.3RR8 pKa = 11.84PKK10 pKa = 8.62VSLRR14 pKa = 11.84KK15 pKa = 8.46PVNMRR20 pKa = 11.84KK21 pKa = 9.18VAMVRR26 pKa = 11.84GG27 pKa = 3.84
MM1 pKa = 7.39AVSLIKK7 pKa = 10.3RR8 pKa = 11.84PKK10 pKa = 8.62VSLRR14 pKa = 11.84KK15 pKa = 8.46PVNMRR20 pKa = 11.84KK21 pKa = 9.18VAMVRR26 pKa = 11.84GG27 pKa = 3.84
Molecular weight: 3.07 kDa
Isoelectric point according different methods:
Peptides (in silico digests for buttom-up proteomics)
Below you can find in silico digests of the whole proteome with Trypsin, Chymotrypsin, Trypsin+LysC, LysN, ArgC proteases suitable for different mass spec machines.| Try ESI |
 |
|---|
| ChTry ESI |
|
|---|
| ArgC ESI |
|
|---|
| LysN ESI |
|
|---|
| TryLysC ESI |
|
|---|
| Try MALDI |
|
|---|
| ChTry MALDI |
|
|---|
| ArgC MALDI |
|
|---|
| LysN MALDI |
|
|---|
| TryLysC MALDI |
|
|---|
| Try LTQ |
|
|---|
| ChTry LTQ |
|
|---|
| ArgC LTQ |
|
|---|
| LysN LTQ |
|
|---|
| TryLysC LTQ |
|
|---|
| Try MSlow |
|
|---|
| ChTry MSlow |
|
|---|
| ArgC MSlow |
|
|---|
| LysN MSlow |
|
|---|
| TryLysC MSlow |
|
|---|
| Try MShigh |
|
|---|
| ChTry MShigh |
|
|---|
| ArgC MShigh |
|
|---|
| LysN MShigh |
|
|---|
| TryLysC MShigh |
|
|---|
General Statistics
Number of major isoforms |
Number of additional isoforms |
Number of all proteins |
Number of amino acids |
Min. Seq. Length |
Max. Seq. Length |
Avg. Seq. Length |
Avg. Mol. Weight |
|---|---|---|---|---|---|---|---|
0 |
28856 |
27 |
2944 |
171.8 |
18.96 |
Amino acid frequency
Ala |
Cys |
Asp |
Glu |
Phe |
Gly |
His |
Ile |
Lys |
Leu |
|---|---|---|---|---|---|---|---|---|---|
10.809 ± 0.476 | 0.856 ± 0.123 |
7.298 ± 0.19 | 6.921 ± 0.265 |
3.088 ± 0.146 | 8.123 ± 0.261 |
2.135 ± 0.161 | 5.302 ± 0.144 |
3.746 ± 0.188 | 7.804 ± 0.176 |
Met |
Asn |
Gln |
Pro |
Arg |
Ser |
Thr |
Val |
Trp |
Tyr |
|---|---|---|---|---|---|---|---|---|---|
2.426 ± 0.088 | 3.181 ± 0.147 |
4.897 ± 0.179 | 3.244 ± 0.24 |
7.17 ± 0.192 | 5.489 ± 0.185 |
5.978 ± 0.17 | 6.824 ± 0.259 |
1.986 ± 0.132 | 2.724 ± 0.16 |
Most of the basic statistics you can see at this page can be downloaded from this CSV file
See this proteome in:

Proteome-pI is available under Creative Commons Attribution-NoDerivs license, for more details see here
| Reference: Kozlowski LP. Proteome-pI 2.0: Proteome Isoelectric Point Database Update. Nucleic Acids Res. 2021, doi: 10.1093/nar/gkab944 | Contact: Lukasz P. Kozlowski |