Novosphingobium ginsenosidimutans
Taxonomy: cellular organisms; Bacteria; Proteobacteria; Alphaproteobacteria; Sphingomonadales; Sphingomonadaceae; Novosphingobium
Average proteome isoelectric point is 6.52
Get precalculated fractions of proteins
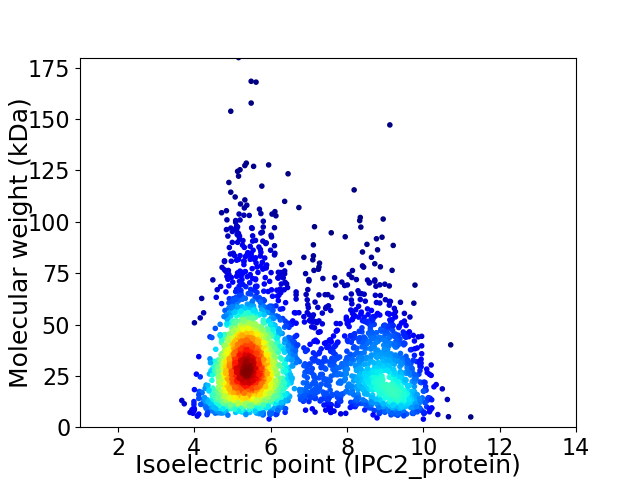
Virtual 2D-PAGE plot for 2985 proteins (isoelectric point calculated using IPC2_protein)
Get csv file with sequences according to given criteria:
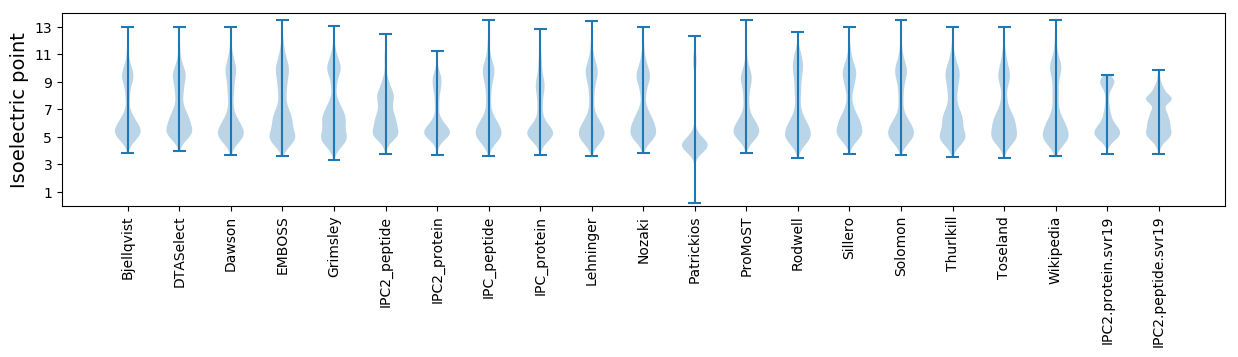
* You can choose from 21 different methods for calculating isoelectric point
Summary statistics related to proteome-wise predictions
Protein with the lowest isoelectric point:
>tr|A0A5B8RZ71|A0A5B8RZ71_9SPHN DUF3696 domain-containing protein OS=Novosphingobium ginsenosidimutans OX=1176536 GN=FRF71_00850 PE=4 SV=1
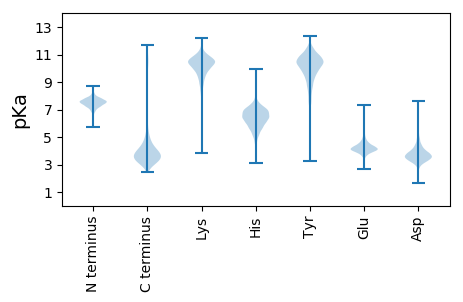
MM1 pKa = 7.58RR2 pKa = 11.84TTFDD6 pKa = 3.04QATVRR11 pKa = 11.84LYY13 pKa = 10.82HH14 pKa = 6.93LDD16 pKa = 3.46SEE18 pKa = 5.3AIGGTATTLLYY29 pKa = 10.98GPLAQVLDD37 pKa = 4.05HH38 pKa = 7.26AAAQDD43 pKa = 3.69PGIQADD49 pKa = 4.42LFIATDD55 pKa = 3.69NDD57 pKa = 3.33VVAYY61 pKa = 10.47LDD63 pKa = 4.95LIGEE67 pKa = 4.41
MM1 pKa = 7.58RR2 pKa = 11.84TTFDD6 pKa = 3.04QATVRR11 pKa = 11.84LYY13 pKa = 10.82HH14 pKa = 6.93LDD16 pKa = 3.46SEE18 pKa = 5.3AIGGTATTLLYY29 pKa = 10.98GPLAQVLDD37 pKa = 4.05HH38 pKa = 7.26AAAQDD43 pKa = 3.69PGIQADD49 pKa = 4.42LFIATDD55 pKa = 3.69NDD57 pKa = 3.33VVAYY61 pKa = 10.47LDD63 pKa = 4.95LIGEE67 pKa = 4.41
Molecular weight: 7.18 kDa
Isoelectric point according different methods:
Protein with the highest isoelectric point:
>tr|A0A5B8S344|A0A5B8S344_9SPHN Uncharacterized protein OS=Novosphingobium ginsenosidimutans OX=1176536 GN=FRF71_02835 PE=4 SV=1
MM1 pKa = 7.45KK2 pKa = 9.61RR3 pKa = 11.84TFQPSNLVRR12 pKa = 11.84ARR14 pKa = 11.84RR15 pKa = 11.84HH16 pKa = 4.45GFRR19 pKa = 11.84ARR21 pKa = 11.84TATVGGRR28 pKa = 11.84KK29 pKa = 9.07VLAARR34 pKa = 11.84RR35 pKa = 11.84ARR37 pKa = 11.84GRR39 pKa = 11.84KK40 pKa = 9.02KK41 pKa = 10.61LSAA44 pKa = 4.03
MM1 pKa = 7.45KK2 pKa = 9.61RR3 pKa = 11.84TFQPSNLVRR12 pKa = 11.84ARR14 pKa = 11.84RR15 pKa = 11.84HH16 pKa = 4.45GFRR19 pKa = 11.84ARR21 pKa = 11.84TATVGGRR28 pKa = 11.84KK29 pKa = 9.07VLAARR34 pKa = 11.84RR35 pKa = 11.84ARR37 pKa = 11.84GRR39 pKa = 11.84KK40 pKa = 9.02KK41 pKa = 10.61LSAA44 pKa = 4.03
Molecular weight: 4.99 kDa
Isoelectric point according different methods:
Peptides (in silico digests for buttom-up proteomics)
Below you can find in silico digests of the whole proteome with Trypsin, Chymotrypsin, Trypsin+LysC, LysN, ArgC proteases suitable for different mass spec machines.| Try ESI |
 |
|---|
| ChTry ESI |
|
|---|
| ArgC ESI |
|
|---|
| LysN ESI |
|
|---|
| TryLysC ESI |
|
|---|
| Try MALDI |
|
|---|
| ChTry MALDI |
|
|---|
| ArgC MALDI |
|
|---|
| LysN MALDI |
|
|---|
| TryLysC MALDI |
|
|---|
| Try LTQ |
|
|---|
| ChTry LTQ |
|
|---|
| ArgC LTQ |
|
|---|
| LysN LTQ |
|
|---|
| TryLysC LTQ |
|
|---|
| Try MSlow |
|
|---|
| ChTry MSlow |
|
|---|
| ArgC MSlow |
|
|---|
| LysN MSlow |
|
|---|
| TryLysC MSlow |
|
|---|
| Try MShigh |
|
|---|
| ChTry MShigh |
|
|---|
| ArgC MShigh |
|
|---|
| LysN MShigh |
|
|---|
| TryLysC MShigh |
|
|---|
General Statistics
Number of major isoforms |
Number of additional isoforms |
Number of all proteins |
Number of amino acids |
Min. Seq. Length |
Max. Seq. Length |
Avg. Seq. Length |
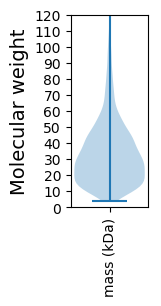
Avg. Mol. Weight |
|---|---|---|---|---|---|---|---|
0 |
950983 |
36 |
1806 |
318.6 |
34.4 |
Amino acid frequency
Ala |
Cys |
Asp |
Glu |
Phe |
Gly |
His |
Ile |
Lys |
Leu |
|---|---|---|---|---|---|---|---|---|---|
13.468 ± 0.071 | 0.838 ± 0.015 |
5.579 ± 0.034 | 5.625 ± 0.035 |
3.562 ± 0.027 | 8.984 ± 0.049 |
1.978 ± 0.022 | 4.768 ± 0.028 |
3.256 ± 0.031 | 10.283 ± 0.057 |
Met |
Asn |
Gln |
Pro |
Arg |
Ser |
Thr |
Val |
Trp |
Tyr |
|---|---|---|---|---|---|---|---|---|---|
2.383 ± 0.023 | 2.581 ± 0.033 |
5.447 ± 0.037 | 3.302 ± 0.026 |
6.995 ± 0.043 | 5.017 ± 0.032 |
5.094 ± 0.037 | 7.134 ± 0.031 |
1.525 ± 0.021 | 2.181 ± 0.025 |
Most of the basic statistics you can see at this page can be downloaded from this CSV file
See this proteome in:

Proteome-pI is available under Creative Commons Attribution-NoDerivs license, for more details see here
| Reference: Kozlowski LP. Proteome-pI 2.0: Proteome Isoelectric Point Database Update. Nucleic Acids Res. 2021, doi: 10.1093/nar/gkab944 | Contact: Lukasz P. Kozlowski |