Anaerofustis stercorihominis DSM 17244
Taxonomy: cellular organisms; Bacteria; Terrabacteria group; Firmicutes; Clostridia; Eubacteriales; Eubacteriaceae; Anaerofustis; Anaerofustis stercorihominis
Average proteome isoelectric point is 6.49
Get precalculated fractions of proteins
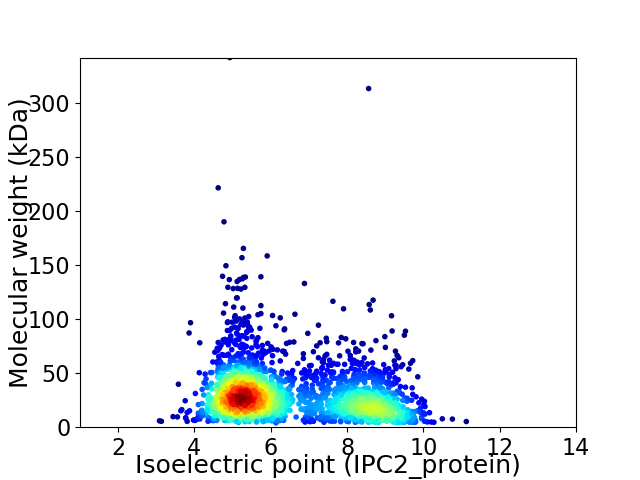
Virtual 2D-PAGE plot for 2331 proteins (isoelectric point calculated using IPC2_protein)
Get csv file with sequences according to given criteria:
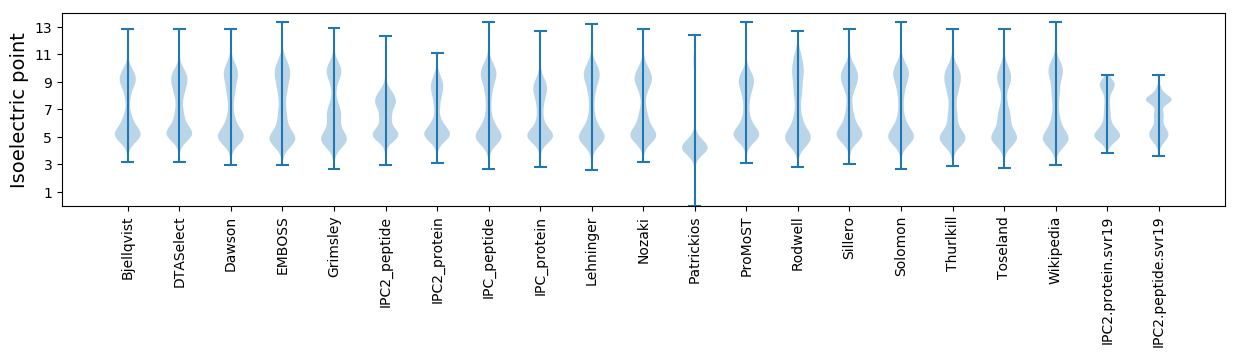
* You can choose from 21 different methods for calculating isoelectric point
Summary statistics related to proteome-wise predictions
Protein with the lowest isoelectric point:
>tr|B1C8C3|B1C8C3_9FIRM Stage 0 sporulation protein A homolog OS=Anaerofustis stercorihominis DSM 17244 OX=445971 GN=ANASTE_00980 PE=4 SV=1
MM1 pKa = 7.6QITKK5 pKa = 10.78DD6 pKa = 3.61MGIMDD11 pKa = 4.93IVNKK15 pKa = 10.0YY16 pKa = 7.97PQAVSVFQAYY26 pKa = 10.33GMGCIGCMAARR37 pKa = 11.84FEE39 pKa = 4.3TLEE42 pKa = 4.27EE43 pKa = 4.08GANAHH48 pKa = 6.93GINVDD53 pKa = 4.75DD54 pKa = 6.2LVDD57 pKa = 4.48DD58 pKa = 4.45LNEE61 pKa = 4.43NII63 pKa = 4.9
MM1 pKa = 7.6QITKK5 pKa = 10.78DD6 pKa = 3.61MGIMDD11 pKa = 4.93IVNKK15 pKa = 10.0YY16 pKa = 7.97PQAVSVFQAYY26 pKa = 10.33GMGCIGCMAARR37 pKa = 11.84FEE39 pKa = 4.3TLEE42 pKa = 4.27EE43 pKa = 4.08GANAHH48 pKa = 6.93GINVDD53 pKa = 4.75DD54 pKa = 6.2LVDD57 pKa = 4.48DD58 pKa = 4.45LNEE61 pKa = 4.43NII63 pKa = 4.9
Molecular weight: 6.88 kDa
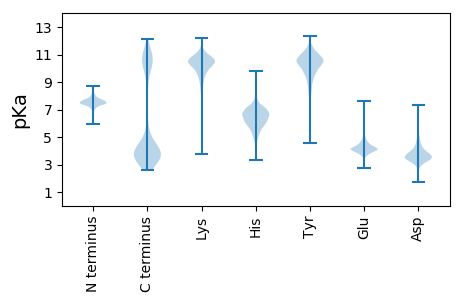
Isoelectric point according different methods:
Protein with the highest isoelectric point:
>tr|B1CBX8|B1CBX8_9FIRM N-acetylglucosaminylphosphatidylinositol deacetylase OS=Anaerofustis stercorihominis DSM 17244 OX=445971 GN=ANASTE_01477 PE=4 SV=1
MM1 pKa = 7.44KK2 pKa = 9.6RR3 pKa = 11.84TFQPNNHH10 pKa = 5.77KK11 pKa = 10.26RR12 pKa = 11.84KK13 pKa = 8.97KK14 pKa = 8.7NHH16 pKa = 5.25GFRR19 pKa = 11.84SRR21 pKa = 11.84MSTPGGKK28 pKa = 9.36NVIRR32 pKa = 11.84NRR34 pKa = 11.84RR35 pKa = 11.84KK36 pKa = 9.89KK37 pKa = 10.47GRR39 pKa = 11.84KK40 pKa = 8.05QLSAA44 pKa = 3.9
MM1 pKa = 7.44KK2 pKa = 9.6RR3 pKa = 11.84TFQPNNHH10 pKa = 5.77KK11 pKa = 10.26RR12 pKa = 11.84KK13 pKa = 8.97KK14 pKa = 8.7NHH16 pKa = 5.25GFRR19 pKa = 11.84SRR21 pKa = 11.84MSTPGGKK28 pKa = 9.36NVIRR32 pKa = 11.84NRR34 pKa = 11.84RR35 pKa = 11.84KK36 pKa = 9.89KK37 pKa = 10.47GRR39 pKa = 11.84KK40 pKa = 8.05QLSAA44 pKa = 3.9
Molecular weight: 5.23 kDa
Isoelectric point according different methods:
Peptides (in silico digests for buttom-up proteomics)
Below you can find in silico digests of the whole proteome with Trypsin, Chymotrypsin, Trypsin+LysC, LysN, ArgC proteases suitable for different mass spec machines.| Try ESI |
 |
|---|
| ChTry ESI |
|
|---|
| ArgC ESI |
|
|---|
| LysN ESI |
|
|---|
| TryLysC ESI |
|
|---|
| Try MALDI |
|
|---|
| ChTry MALDI |
|
|---|
| ArgC MALDI |
|
|---|
| LysN MALDI |
|
|---|
| TryLysC MALDI |
|
|---|
| Try LTQ |
|
|---|
| ChTry LTQ |
|
|---|
| ArgC LTQ |
|
|---|
| LysN LTQ |
|
|---|
| TryLysC LTQ |
|
|---|
| Try MSlow |
|
|---|
| ChTry MSlow |
|
|---|
| ArgC MSlow |
|
|---|
| LysN MSlow |
|
|---|
| TryLysC MSlow |
|
|---|
| Try MShigh |
|
|---|
| ChTry MShigh |
|
|---|
| ArgC MShigh |
|
|---|
| LysN MShigh |
|
|---|
| TryLysC MShigh |
|
|---|
General Statistics
Number of major isoforms |
Number of additional isoforms |
Number of all proteins |
Number of amino acids |
Min. Seq. Length |
Max. Seq. Length |
Avg. Seq. Length |
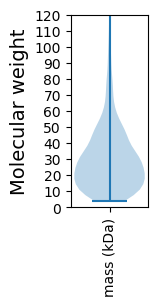
Avg. Mol. Weight |
|---|---|---|---|---|---|---|---|
0 |
660854 |
39 |
3037 |
283.5 |
31.98 |
Amino acid frequency
Ala |
Cys |
Asp |
Glu |
Phe |
Gly |
His |
Ile |
Lys |
Leu |
|---|---|---|---|---|---|---|---|---|---|
5.631 ± 0.054 | 1.249 ± 0.024 |
6.286 ± 0.047 | 7.267 ± 0.06 |
4.428 ± 0.046 | 6.456 ± 0.057 |
1.418 ± 0.023 | 9.382 ± 0.073 |
9.574 ± 0.059 | 8.693 ± 0.068 |
Met |
Asn |
Gln |
Pro |
Arg |
Ser |
Thr |
Val |
Trp |
Tyr |
|---|---|---|---|---|---|---|---|---|---|
2.778 ± 0.027 | 6.217 ± 0.049 |
2.69 ± 0.028 | 1.875 ± 0.022 |
3.193 ± 0.037 | 6.405 ± 0.049 |
5.096 ± 0.045 | 6.509 ± 0.045 |
0.524 ± 0.014 | 4.33 ± 0.041 |
Most of the basic statistics you can see at this page can be downloaded from this CSV file
See this proteome in:

Proteome-pI is available under Creative Commons Attribution-NoDerivs license, for more details see here
| Reference: Kozlowski LP. Proteome-pI 2.0: Proteome Isoelectric Point Database Update. Nucleic Acids Res. 2021, doi: 10.1093/nar/gkab944 | Contact: Lukasz P. Kozlowski |