Paulinella micropora
Taxonomy: cellular organisms; Eukaryota; Sar; Rhizaria; Imbricatea; Silicofilosea; Euglyphida; Paulinellidae; Paulinella
Average proteome isoelectric point is 6.77
Get precalculated fractions of proteins
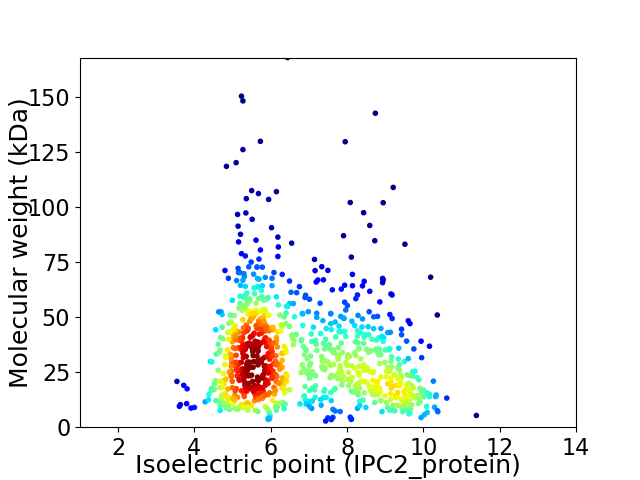
Virtual 2D-PAGE plot for 897 proteins (isoelectric point calculated using IPC2_protein)
Get csv file with sequences according to given criteria:
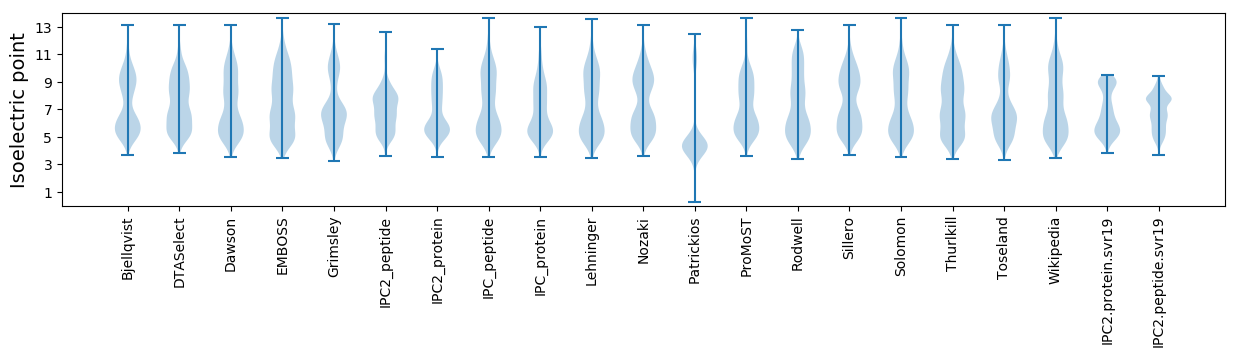
* You can choose from 21 different methods for calculating isoelectric point
Summary statistics related to proteome-wise predictions
Protein with the lowest isoelectric point:
>tr|A0A1L5YCZ3|A0A1L5YCZ3_9EUKA Glutaredoxin OS=Paulinella micropora OX=1928728 GN=MYN1_Chr_733 PE=3 SV=1
MM1 pKa = 7.31LHH3 pKa = 7.07LSNLLLAAVMWVQVPQWSADD23 pKa = 3.13WSKK26 pKa = 11.17CAVDD30 pKa = 5.23LPDD33 pKa = 5.15VNCHH37 pKa = 5.69WYY39 pKa = 10.4VVAPDD44 pKa = 3.48NTFGEE49 pKa = 4.69GFDD52 pKa = 3.64WATSPWFDD60 pKa = 4.62ANGLQDD66 pKa = 3.6ISALHH71 pKa = 5.5EE72 pKa = 4.34TLTNLQNSS80 pKa = 3.94
MM1 pKa = 7.31LHH3 pKa = 7.07LSNLLLAAVMWVQVPQWSADD23 pKa = 3.13WSKK26 pKa = 11.17CAVDD30 pKa = 5.23LPDD33 pKa = 5.15VNCHH37 pKa = 5.69WYY39 pKa = 10.4VVAPDD44 pKa = 3.48NTFGEE49 pKa = 4.69GFDD52 pKa = 3.64WATSPWFDD60 pKa = 4.62ANGLQDD66 pKa = 3.6ISALHH71 pKa = 5.5EE72 pKa = 4.34TLTNLQNSS80 pKa = 3.94
Molecular weight: 9.0 kDa
Isoelectric point according different methods:
Protein with the highest isoelectric point:
>tr|A0A1L5YCQ6|A0A1L5YCQ6_9EUKA 30S ribosomal protein S4 OS=Paulinella micropora OX=1928728 GN=rps4 PE=3 SV=1
MM1 pKa = 7.55TKK3 pKa = 9.01RR4 pKa = 11.84TLGGTSRR11 pKa = 11.84KK12 pKa = 9.07RR13 pKa = 11.84KK14 pKa = 8.17RR15 pKa = 11.84VSGFRR20 pKa = 11.84VRR22 pKa = 11.84MRR24 pKa = 11.84SITGRR29 pKa = 11.84RR30 pKa = 11.84VIRR33 pKa = 11.84TRR35 pKa = 11.84RR36 pKa = 11.84KK37 pKa = 8.74RR38 pKa = 11.84GRR40 pKa = 11.84ARR42 pKa = 11.84LSVV45 pKa = 3.2
MM1 pKa = 7.55TKK3 pKa = 9.01RR4 pKa = 11.84TLGGTSRR11 pKa = 11.84KK12 pKa = 9.07RR13 pKa = 11.84KK14 pKa = 8.17RR15 pKa = 11.84VSGFRR20 pKa = 11.84VRR22 pKa = 11.84MRR24 pKa = 11.84SITGRR29 pKa = 11.84RR30 pKa = 11.84VIRR33 pKa = 11.84TRR35 pKa = 11.84RR36 pKa = 11.84KK37 pKa = 8.74RR38 pKa = 11.84GRR40 pKa = 11.84ARR42 pKa = 11.84LSVV45 pKa = 3.2
Molecular weight: 5.34 kDa
Isoelectric point according different methods:
Peptides (in silico digests for buttom-up proteomics)
Below you can find in silico digests of the whole proteome with Trypsin, Chymotrypsin, Trypsin+LysC, LysN, ArgC proteases suitable for different mass spec machines.| Try ESI |
 |
|---|
| ChTry ESI |
|
|---|
| ArgC ESI |
|
|---|
| LysN ESI |
|
|---|
| TryLysC ESI |
|
|---|
| Try MALDI |
|
|---|
| ChTry MALDI |
|
|---|
| ArgC MALDI |
|
|---|
| LysN MALDI |
|
|---|
| TryLysC MALDI |
|
|---|
| Try LTQ |
|
|---|
| ChTry LTQ |
|
|---|
| ArgC LTQ |
|
|---|
| LysN LTQ |
|
|---|
| TryLysC LTQ |
|
|---|
| Try MSlow |
|
|---|
| ChTry MSlow |
|
|---|
| ArgC MSlow |
|
|---|
| LysN MSlow |
|
|---|
| TryLysC MSlow |
|
|---|
| Try MShigh |
|
|---|
| ChTry MShigh |
|
|---|
| ArgC MShigh |
|
|---|
| LysN MShigh |
|
|---|
| TryLysC MShigh |
|
|---|
General Statistics
Number of major isoforms |
Number of additional isoforms |
Number of all proteins |
Number of amino acids |
Min. Seq. Length |
Max. Seq. Length |
Avg. Seq. Length |
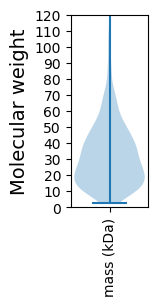
Avg. Mol. Weight |
|---|---|---|---|---|---|---|---|
0 |
272856 |
26 |
1535 |
304.2 |
33.88 |
Amino acid frequency
Ala |
Cys |
Asp |
Glu |
Phe |
Gly |
His |
Ile |
Lys |
Leu |
|---|---|---|---|---|---|---|---|---|---|
7.371 ± 0.075 | 1.3 ± 0.026 |
4.719 ± 0.055 | 5.79 ± 0.071 |
3.967 ± 0.109 | 7.114 ± 0.07 |
2.086 ± 0.042 | 7.561 ± 0.068 |
4.556 ± 0.067 | 11.853 ± 0.1 |
Met |
Asn |
Gln |
Pro |
Arg |
Ser |
Thr |
Val |
Trp |
Tyr |
|---|---|---|---|---|---|---|---|---|---|
2.06 ± 0.032 | 4.304 ± 0.047 |
4.461 ± 0.047 | 4.14 ± 0.048 |
5.885 ± 0.054 | 7.084 ± 0.065 |
5.315 ± 0.051 | 6.336 ± 0.061 |
1.418 ± 0.037 | 2.682 ± 0.04 |
Most of the basic statistics you can see at this page can be downloaded from this CSV file
See this proteome in:

Proteome-pI is available under Creative Commons Attribution-NoDerivs license, for more details see here
| Reference: Kozlowski LP. Proteome-pI 2.0: Proteome Isoelectric Point Database Update. Nucleic Acids Res. 2021, doi: 10.1093/nar/gkab944 | Contact: Lukasz P. Kozlowski |