Lactobacillus phage P1
Taxonomy: Viruses; Duplodnaviria; Heunggongvirae; Uroviricota; Caudoviricetes; Caudovirales; Siphoviridae; Tybeckvirinae; Maenadvirus; Lactobacillus virus P1
Average proteome isoelectric point is 6.17
Get precalculated fractions of proteins
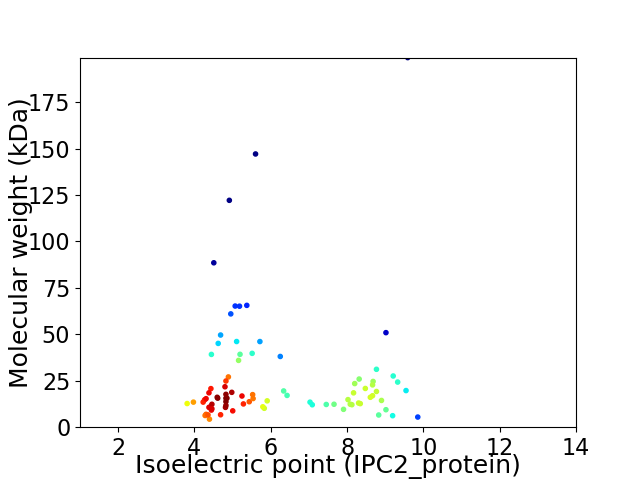
Virtual 2D-PAGE plot for 86 proteins (isoelectric point calculated using IPC2_protein)
Get csv file with sequences according to given criteria:
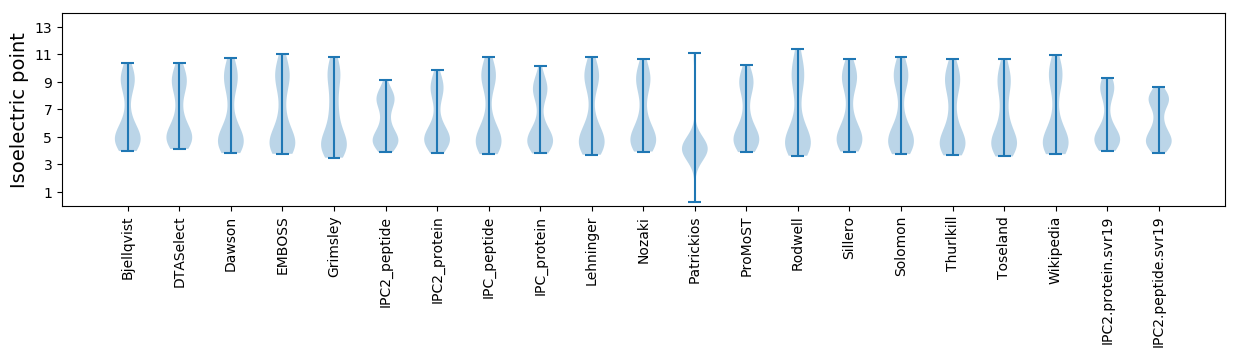
* You can choose from 21 different methods for calculating isoelectric point
Summary statistics related to proteome-wise predictions
Protein with the lowest isoelectric point:
>tr|A0A1S5RCT2|A0A1S5RCT2_9CAUD Uncharacterized protein OS=Lactobacillus phage P1 OX=1846168 GN=LVP1_g043 PE=4 SV=1
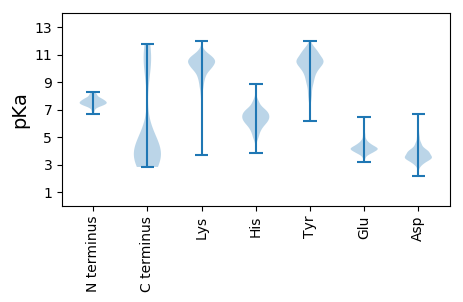
MM1 pKa = 7.76DD2 pKa = 4.07TLINILTFLLVAALMVVFYY21 pKa = 10.46GIVAAVLGALWGFNVSLALALRR43 pKa = 11.84AGVTGYY49 pKa = 9.97ILSIVAPMIFCSPSSDD65 pKa = 3.36EE66 pKa = 4.09
MM1 pKa = 7.76DD2 pKa = 4.07TLINILTFLLVAALMVVFYY21 pKa = 10.46GIVAAVLGALWGFNVSLALALRR43 pKa = 11.84AGVTGYY49 pKa = 9.97ILSIVAPMIFCSPSSDD65 pKa = 3.36EE66 pKa = 4.09
Molecular weight: 6.93 kDa
Isoelectric point according different methods:
Protein with the highest isoelectric point:
>tr|A0A1S5RCS0|A0A1S5RCS0_9CAUD PemK family transcriptional regulator OS=Lactobacillus phage P1 OX=1846168 GN=LVP1_g038 PE=4 SV=1
MM1 pKa = 7.25VCFLHH6 pKa = 6.86RR7 pKa = 11.84KK8 pKa = 8.79KK9 pKa = 10.89KK10 pKa = 10.21EE11 pKa = 3.82GYY13 pKa = 9.49LYY15 pKa = 10.33EE16 pKa = 4.54GNFRR20 pKa = 11.84RR21 pKa = 11.84TTIKK25 pKa = 10.41RR26 pKa = 11.84LKK28 pKa = 10.08DD29 pKa = 3.36LKK31 pKa = 10.91RR32 pKa = 11.84PNTQIKK38 pKa = 10.22KK39 pKa = 9.54MYY41 pKa = 10.24FLAA44 pKa = 5.55
MM1 pKa = 7.25VCFLHH6 pKa = 6.86RR7 pKa = 11.84KK8 pKa = 8.79KK9 pKa = 10.89KK10 pKa = 10.21EE11 pKa = 3.82GYY13 pKa = 9.49LYY15 pKa = 10.33EE16 pKa = 4.54GNFRR20 pKa = 11.84RR21 pKa = 11.84TTIKK25 pKa = 10.41RR26 pKa = 11.84LKK28 pKa = 10.08DD29 pKa = 3.36LKK31 pKa = 10.91RR32 pKa = 11.84PNTQIKK38 pKa = 10.22KK39 pKa = 9.54MYY41 pKa = 10.24FLAA44 pKa = 5.55
Molecular weight: 5.46 kDa
Isoelectric point according different methods:
Peptides (in silico digests for buttom-up proteomics)
Below you can find in silico digests of the whole proteome with Trypsin, Chymotrypsin, Trypsin+LysC, LysN, ArgC proteases suitable for different mass spec machines.| Try ESI |
 |
|---|
| ChTry ESI |
|
|---|
| ArgC ESI |
|
|---|
| LysN ESI |
|
|---|
| TryLysC ESI |
|
|---|
| Try MALDI |
|
|---|
| ChTry MALDI |
|
|---|
| ArgC MALDI |
|
|---|
| LysN MALDI |
|
|---|
| TryLysC MALDI |
|
|---|
| Try LTQ |
|
|---|
| ChTry LTQ |
|
|---|
| ArgC LTQ |
|
|---|
| LysN LTQ |
|
|---|
| TryLysC LTQ |
|
|---|
| Try MSlow |
|
|---|
| ChTry MSlow |
|
|---|
| ArgC MSlow |
|
|---|
| LysN MSlow |
|
|---|
| TryLysC MSlow |
|
|---|
| Try MShigh |
|
|---|
| ChTry MShigh |
|
|---|
| ArgC MShigh |
|
|---|
| LysN MShigh |
|
|---|
| TryLysC MShigh |
|
|---|
General Statistics
Number of major isoforms |
Number of additional isoforms |
Number of all proteins |
Number of amino acids |
Min. Seq. Length |
Max. Seq. Length |
Avg. Seq. Length |
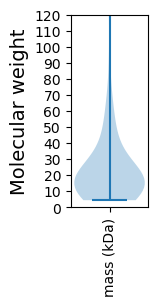
Avg. Mol. Weight |
|---|---|---|---|---|---|---|---|
0 |
20139 |
38 |
1887 |
234.2 |
26.3 |
Amino acid frequency
Ala |
Cys |
Asp |
Glu |
Phe |
Gly |
His |
Ile |
Lys |
Leu |
|---|---|---|---|---|---|---|---|---|---|
6.828 ± 0.507 | 0.69 ± 0.105 |
6.981 ± 0.457 | 6.003 ± 0.329 |
3.883 ± 0.182 | 6.932 ± 0.454 |
1.817 ± 0.144 | 6.296 ± 0.193 |
8.069 ± 0.357 | 8.178 ± 0.209 |
Met |
Asn |
Gln |
Pro |
Arg |
Ser |
Thr |
Val |
Trp |
Tyr |
|---|---|---|---|---|---|---|---|---|---|
2.304 ± 0.097 | 6.103 ± 0.217 |
2.741 ± 0.157 | 3.62 ± 0.199 |
3.863 ± 0.216 | 7.051 ± 0.333 |
6.356 ± 0.315 | 6.609 ± 0.266 |
1.226 ± 0.119 | 4.449 ± 0.282 |
Most of the basic statistics you can see at this page can be downloaded from this CSV file
See this proteome in:

Proteome-pI is available under Creative Commons Attribution-NoDerivs license, for more details see here
| Reference: Kozlowski LP. Proteome-pI 2.0: Proteome Isoelectric Point Database Update. Nucleic Acids Res. 2021, doi: 10.1093/nar/gkab944 | Contact: Lukasz P. Kozlowski |