Arthrobacter phage Oxynfrius
Taxonomy: Viruses; Duplodnaviria; Heunggongvirae; Uroviricota; Caudoviricetes; Caudovirales; Siphoviridae; Korravirus; unclassified Korravirus
Average proteome isoelectric point is 6.23
Get precalculated fractions of proteins
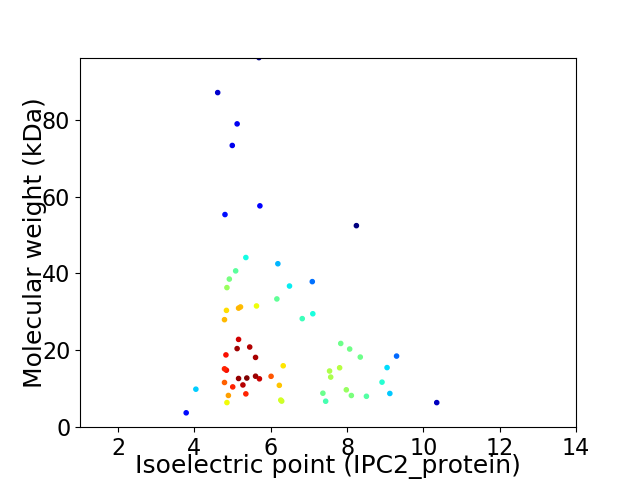
Virtual 2D-PAGE plot for 62 proteins (isoelectric point calculated using IPC2_protein)
Get csv file with sequences according to given criteria:
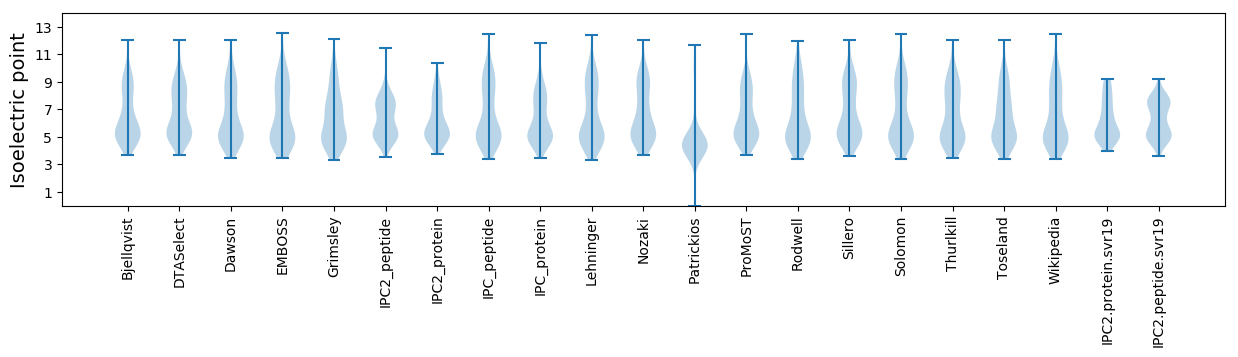
* You can choose from 21 different methods for calculating isoelectric point
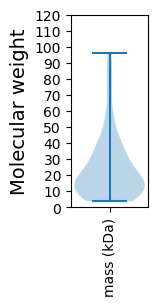
Summary statistics related to proteome-wise predictions
Protein with the lowest isoelectric point:
>tr|A0A1I9SE21|A0A1I9SE21_9CAUD HNH endonuclease OS=Arthrobacter phage Oxynfrius OX=1897429 GN=SEA_OXYNFRIUS_62 PE=4 SV=1
MM1 pKa = 7.8DD2 pKa = 4.88FCWEE6 pKa = 4.09DD7 pKa = 3.71SEE9 pKa = 5.03TGCICGNEE17 pKa = 4.13CEE19 pKa = 4.32PPKK22 pKa = 10.63WMIQMWEE29 pKa = 4.21GEE31 pKa = 4.41GG32 pKa = 3.51
MM1 pKa = 7.8DD2 pKa = 4.88FCWEE6 pKa = 4.09DD7 pKa = 3.71SEE9 pKa = 5.03TGCICGNEE17 pKa = 4.13CEE19 pKa = 4.32PPKK22 pKa = 10.63WMIQMWEE29 pKa = 4.21GEE31 pKa = 4.41GG32 pKa = 3.51
Molecular weight: 3.74 kDa
Isoelectric point according different methods:
Protein with the highest isoelectric point:
>tr|A0A1I9SE20|A0A1I9SE20_9CAUD Uncharacterized protein OS=Arthrobacter phage Oxynfrius OX=1897429 GN=SEA_OXYNFRIUS_61 PE=4 SV=1
MM1 pKa = 7.11QATPEE6 pKa = 4.26VKK8 pKa = 9.0TRR10 pKa = 11.84PVLPHH15 pKa = 5.65TFGRR19 pKa = 11.84PDD21 pKa = 3.18MAGLTRR27 pKa = 11.84MQRR30 pKa = 11.84RR31 pKa = 11.84GIAKK35 pKa = 10.16LKK37 pKa = 8.71RR38 pKa = 11.84QKK40 pKa = 10.44GQPSKK45 pKa = 11.23VEE47 pKa = 3.75RR48 pKa = 11.84TQSKK52 pKa = 10.39KK53 pKa = 10.1RR54 pKa = 11.84GKK56 pKa = 10.02
MM1 pKa = 7.11QATPEE6 pKa = 4.26VKK8 pKa = 9.0TRR10 pKa = 11.84PVLPHH15 pKa = 5.65TFGRR19 pKa = 11.84PDD21 pKa = 3.18MAGLTRR27 pKa = 11.84MQRR30 pKa = 11.84RR31 pKa = 11.84GIAKK35 pKa = 10.16LKK37 pKa = 8.71RR38 pKa = 11.84QKK40 pKa = 10.44GQPSKK45 pKa = 11.23VEE47 pKa = 3.75RR48 pKa = 11.84TQSKK52 pKa = 10.39KK53 pKa = 10.1RR54 pKa = 11.84GKK56 pKa = 10.02
Molecular weight: 6.4 kDa
Isoelectric point according different methods:
Peptides (in silico digests for buttom-up proteomics)
Below you can find in silico digests of the whole proteome with Trypsin, Chymotrypsin, Trypsin+LysC, LysN, ArgC proteases suitable for different mass spec machines.| Try ESI |
 |
|---|
| ChTry ESI |
|
|---|
| ArgC ESI |
|
|---|
| LysN ESI |
|
|---|
| TryLysC ESI |
|
|---|
| Try MALDI |
|
|---|
| ChTry MALDI |
|
|---|
| ArgC MALDI |
|
|---|
| LysN MALDI |
|
|---|
| TryLysC MALDI |
|
|---|
| Try LTQ |
|
|---|
| ChTry LTQ |
|
|---|
| ArgC LTQ |
|
|---|
| LysN LTQ |
|
|---|
| TryLysC LTQ |
|
|---|
| Try MSlow |
|
|---|
| ChTry MSlow |
|
|---|
| ArgC MSlow |
|
|---|
| LysN MSlow |
|
|---|
| TryLysC MSlow |
|
|---|
| Try MShigh |
|
|---|
| ChTry MShigh |
|
|---|
| ArgC MShigh |
|
|---|
| LysN MShigh |
|
|---|
| TryLysC MShigh |
|
|---|
General Statistics
Number of major isoforms |
Number of additional isoforms |
Number of all proteins |
Number of amino acids |
Min. Seq. Length |
Max. Seq. Length |
Avg. Seq. Length |
Avg. Mol. Weight |
|---|---|---|---|---|---|---|---|
0 |
14024 |
32 |
876 |
226.2 |
24.73 |
Amino acid frequency
Ala |
Cys |
Asp |
Glu |
Phe |
Gly |
His |
Ile |
Lys |
Leu |
|---|---|---|---|---|---|---|---|---|---|
10.218 ± 0.396 | 0.713 ± 0.152 |
5.647 ± 0.243 | 6.489 ± 0.331 |
2.988 ± 0.207 | 8.657 ± 0.352 |
1.875 ± 0.169 | 5.106 ± 0.307 |
5.056 ± 0.32 | 8.393 ± 0.286 |
Met |
Asn |
Gln |
Pro |
Arg |
Ser |
Thr |
Val |
Trp |
Tyr |
|---|---|---|---|---|---|---|---|---|---|
2.282 ± 0.152 | 3.587 ± 0.181 |
5.141 ± 0.181 | 4.022 ± 0.168 |
5.59 ± 0.353 | 6.139 ± 0.343 |
6.482 ± 0.328 | 7.152 ± 0.324 |
1.989 ± 0.183 | 2.474 ± 0.129 |
Most of the basic statistics you can see at this page can be downloaded from this CSV file
See this proteome in:

Proteome-pI is available under Creative Commons Attribution-NoDerivs license, for more details see here
| Reference: Kozlowski LP. Proteome-pI 2.0: Proteome Isoelectric Point Database Update. Nucleic Acids Res. 2021, doi: 10.1093/nar/gkab944 | Contact: Lukasz P. Kozlowski |