Bacteroides sp. CAG:545
Taxonomy: cellular organisms; Bacteria; FCB group; Bacteroidetes/Chlorobi group; Bacteroidetes; Bacteroidia; Bacteroidales; Bacteroidaceae; Bacteroides; environmental samples
Average proteome isoelectric point is 6.13
Get precalculated fractions of proteins
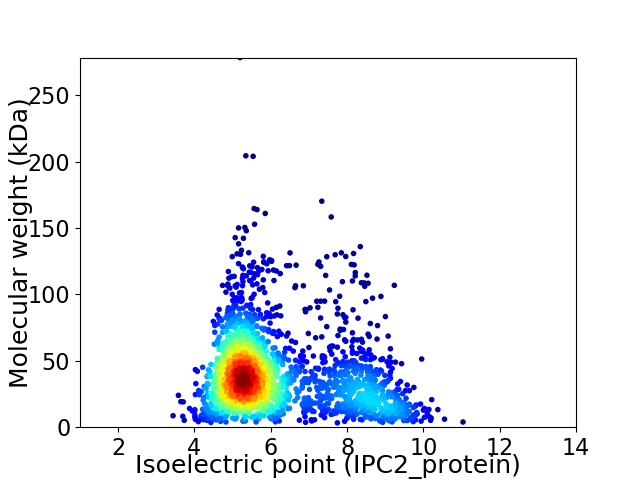
Virtual 2D-PAGE plot for 2183 proteins (isoelectric point calculated using IPC2_protein)
Get csv file with sequences according to given criteria:
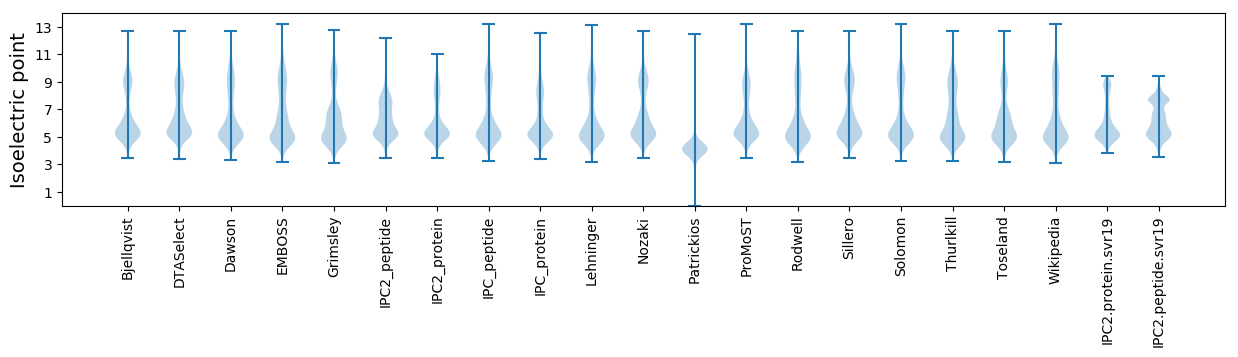
* You can choose from 21 different methods for calculating isoelectric point
Summary statistics related to proteome-wise predictions
Protein with the lowest isoelectric point:
>tr|R5RVL8|R5RVL8_9BACE Uncharacterized protein OS=Bacteroides sp. CAG:545 OX=1262742 GN=BN702_00012 PE=4 SV=1
MM1 pKa = 7.69NYY3 pKa = 9.79QKK5 pKa = 10.75PQMDD9 pKa = 4.33VLVLGCDD16 pKa = 3.28EE17 pKa = 4.81RR18 pKa = 11.84FAASTISTDD27 pKa = 3.11QIYY30 pKa = 10.21FEE32 pKa = 5.17EE33 pKa = 4.82GTMDD37 pKa = 3.98NDD39 pKa = 4.69FNTEE43 pKa = 3.77NNN45 pKa = 3.47
MM1 pKa = 7.69NYY3 pKa = 9.79QKK5 pKa = 10.75PQMDD9 pKa = 4.33VLVLGCDD16 pKa = 3.28EE17 pKa = 4.81RR18 pKa = 11.84FAASTISTDD27 pKa = 3.11QIYY30 pKa = 10.21FEE32 pKa = 5.17EE33 pKa = 4.82GTMDD37 pKa = 3.98NDD39 pKa = 4.69FNTEE43 pKa = 3.77NNN45 pKa = 3.47
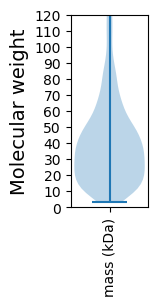
Molecular weight: 5.2 kDa
Isoelectric point according different methods:
Protein with the highest isoelectric point:
>tr|R5RQ78|R5RQ78_9BACE Dihydrodipicolinate reductase OS=Bacteroides sp. CAG:545 OX=1262742 GN=BN702_01599 PE=3 SV=1
MM1 pKa = 7.84PSGKK5 pKa = 9.39KK6 pKa = 9.62RR7 pKa = 11.84KK8 pKa = 6.72RR9 pKa = 11.84HH10 pKa = 5.17KK11 pKa = 10.05MATHH15 pKa = 6.02KK16 pKa = 10.34RR17 pKa = 11.84KK18 pKa = 9.84KK19 pKa = 9.28RR20 pKa = 11.84LRR22 pKa = 11.84KK23 pKa = 9.28NRR25 pKa = 11.84HH26 pKa = 4.81KK27 pKa = 10.86NKK29 pKa = 10.25KK30 pKa = 8.92KK31 pKa = 10.55
MM1 pKa = 7.84PSGKK5 pKa = 9.39KK6 pKa = 9.62RR7 pKa = 11.84KK8 pKa = 6.72RR9 pKa = 11.84HH10 pKa = 5.17KK11 pKa = 10.05MATHH15 pKa = 6.02KK16 pKa = 10.34RR17 pKa = 11.84KK18 pKa = 9.84KK19 pKa = 9.28RR20 pKa = 11.84LRR22 pKa = 11.84KK23 pKa = 9.28NRR25 pKa = 11.84HH26 pKa = 4.81KK27 pKa = 10.86NKK29 pKa = 10.25KK30 pKa = 8.92KK31 pKa = 10.55
Molecular weight: 3.92 kDa
Isoelectric point according different methods:
Peptides (in silico digests for buttom-up proteomics)
Below you can find in silico digests of the whole proteome with Trypsin, Chymotrypsin, Trypsin+LysC, LysN, ArgC proteases suitable for different mass spec machines.| Try ESI |
 |
|---|
| ChTry ESI |
|
|---|
| ArgC ESI |
|
|---|
| LysN ESI |
|
|---|
| TryLysC ESI |
|
|---|
| Try MALDI |
|
|---|
| ChTry MALDI |
|
|---|
| ArgC MALDI |
|
|---|
| LysN MALDI |
|
|---|
| TryLysC MALDI |
|
|---|
| Try LTQ |
|
|---|
| ChTry LTQ |
|
|---|
| ArgC LTQ |
|
|---|
| LysN LTQ |
|
|---|
| TryLysC LTQ |
|
|---|
| Try MSlow |
|
|---|
| ChTry MSlow |
|
|---|
| ArgC MSlow |
|
|---|
| LysN MSlow |
|
|---|
| TryLysC MSlow |
|
|---|
| Try MShigh |
|
|---|
| ChTry MShigh |
|
|---|
| ArgC MShigh |
|
|---|
| LysN MShigh |
|
|---|
| TryLysC MShigh |
|
|---|
General Statistics
Number of major isoforms |
Number of additional isoforms |
Number of all proteins |
Number of amino acids |
Min. Seq. Length |
Max. Seq. Length |
Avg. Seq. Length |
Avg. Mol. Weight |
|---|---|---|---|---|---|---|---|
0 |
809031 |
30 |
2497 |
370.6 |
41.29 |
Amino acid frequency
Ala |
Cys |
Asp |
Glu |
Phe |
Gly |
His |
Ile |
Lys |
Leu |
|---|---|---|---|---|---|---|---|---|---|
7.961 ± 0.052 | 1.343 ± 0.022 |
6.11 ± 0.038 | 6.294 ± 0.048 |
4.422 ± 0.033 | 7.398 ± 0.05 |
1.645 ± 0.02 | 6.255 ± 0.04 |
6.396 ± 0.043 | 8.399 ± 0.05 |
Met |
Asn |
Gln |
Pro |
Arg |
Ser |
Thr |
Val |
Trp |
Tyr |
|---|---|---|---|---|---|---|---|---|---|
2.723 ± 0.024 | 4.626 ± 0.043 |
3.811 ± 0.029 | 2.735 ± 0.027 |
4.626 ± 0.037 | 7.143 ± 0.047 |
5.6 ± 0.04 | 7.007 ± 0.04 |
1.288 ± 0.02 | 4.217 ± 0.039 |
Most of the basic statistics you can see at this page can be downloaded from this CSV file
See this proteome in:

Proteome-pI is available under Creative Commons Attribution-NoDerivs license, for more details see here
| Reference: Kozlowski LP. Proteome-pI 2.0: Proteome Isoelectric Point Database Update. Nucleic Acids Res. 2021, doi: 10.1093/nar/gkab944 | Contact: Lukasz P. Kozlowski |